Key findings
- Two war economies of unequal size. In 2025 Russia spent an estimated USD 190 billion (at current prices) on its military, 7.5 per cent of its economic output; Ukraine spent USD 84.1 billion, 40 per cent of its output, the highest share in the world. Adjusted for inflation, Russia spends 2.3 times as much as in 2014 and Ukraine 17.6 times as much (section 4).
- The world is rearming. World military spending has risen by 43 per cent in real terms since 2014; in Central and Western Europe it has risen by 87 per cent. The European NATO members and Canada raised their spending from 1.40 to 2.27 per cent of economic output (GDP) and have committed to at least 3.5 per cent for core defence, plus up to 1.5 per cent for related investment, by 2035. Almost half of Europe’s arms imports come from the United States (section 5).
- Russia pays increasingly from its own citizens. Oil and gas bring about a quarter of federal revenue; value-added tax has been raised to 22 per cent, the deficit is widening and inflation stood at 6.3 per cent in September 2026. Russia has still earned more than EUR 1 trillion from fossil-fuel exports since the invasion. China and India buy most of its crude oil; the EU remains the largest buyer of its liquefied natural gas (sections 6, 7 and 11).
- Ukraine pays for its army itself and borrows for the rest. Domestic revenue covered 60 per cent of budget spending in 2025. Europe replaced American aid in 2025, but about 82 per cent of EU assistance consists of loans. Ukraine’s state debt has more than doubled since 2021 to USD 213.3 billion, as large as its economy (section 8).
- Much of the aid is spent in the donor countries. About 60 per cent of US aid related to the war, and 90 per cent of US military aid, is spent in the United States, with contracts in at least 38 states. The audits and studies reviewed found no evidence that a large part of US aid or of Western-supplied weapons has gone missing or been systematically diverted (sections 9 and 15).
- The documented winners are arms makers, energy suppliers and some financial institutions. The 100 largest arms makers earned a record USD 679 billion in 2024; Europe’s grew fastest, led by the Czechoslovak Group (+193 per cent) and Rheinmetall (+47 per cent). Russia’s state-owned Rostec raised its revenue but saw its profit fall by 42 per cent. US suppliers provided 58 per cent of the EU’s imported liquefied gas in 2025. A large portion of Euroclear’s windfall profits on frozen Russian assets is paid to the EU for Ukraine (sections 10 to 12).
- Ukrainians bear the largest cost, with economic and social losses of USD 666.7 billion, followed by Russian households and European taxpayers, who pay the interest on an EU loan that Ukraine repays only if Russia pays reparations (section 14).
- Reconstruction has barely begun. Needs are estimated at USD 587.7 billion over ten years; investment by global companies is modest so far, apart from the arms industry. Ukrainian anti-corruption authorities have uncovered several cases, the largest in the state nuclear company (section 13).
- Popular claims often fail. The United States did not give Ukraine USD 350 billion; BlackRock does not own Ukraine; foreign corporations do not own its farmland. Corruption in Ukraine is real but documented and prosecuted case by case (section 15).
Method and review. Evidence cutoff: 5 October 2026. 295 sources — budget laws, official statistics, audit reports, company accounts, research data and investigative journalism — were downloaded and analysed locally; 195 are cited. Every quotation and every figure was checked by script for its presence in the stored source text; interpretation and arithmetic were checked in a separate step by the AI system that drafted the text and, for a sample of 20 sentences, by separate AI agents. The report covers 2006 to October 2026, with the weight on 2014–2026; it makes no forecasts, audits no company accounts and makes no legal findings. The main uncertainties are Russia’s classified budget, estimates of its off-budget lending and the differing definitions of aid. Earning money from the war is not by itself evidence of wrongdoing; allegations are reported with their procedural status. The publisher approved this edition on 8 October 2026; external specialist review is not part of the Countersigned model. Details: “Method and evidence limits”.
1. The money in brief
The war between Russia and Ukraine moves money on a scale that is hard to grasp. The largest flows documented in this report are of very different kinds:
- War budgets. In 2025 Russia spent an estimated USD 190 billion on its military and Ukraine USD 84.1 billion, at current prices, according to the Stockholm International Peace Research Institute (SIPRI) (S117). Military spending worldwide reached USD 2,887 billion (S117).
- Russia’s export earnings. Since the full-scale invasion, Russia has earned more than EUR 1 trillion from exporting fossil fuels, according to the Centre for Research on Energy and Clean Air (CREA) (S176).
- Aid to Ukraine. The EU and its member states count EUR 224.5 billion of support since 2022 (S022). The US Congress has made USD 196.43 billion available for its response to the war, of which USD 121.16 billion had been paid out by mid-2026 (S137).
- Arms sales. The world’s 100 largest arms makers earned a record USD 679 billion from weapons in 2024 (S069).
- Frozen money. About EUR 210 billion of Russia’s central-bank reserves sits as cash at European financial institutions (S298).
- Reconstruction. Rebuilding Ukraine is estimated to require USD 587.7 billion over ten years (S242).
These figures cannot be added together. They measure different things — a year’s budget, four years of export revenue, money promised, money paid, a stock of frozen assets, needs for the coming decade — and some of the same money appears more than once: a euro that the EU lends to Ukraine may be spent on ammunition and then reappear as revenue of an arms maker.
How to read the figures in this report. Five distinctions matter throughout.
- Promised, earmarked or paid. Governments announce commitments; the Kiel Institute for the World Economy counts aid as “allocated” once it is earmarked for specific deliveries; budgets are “disbursed” only when money is actually paid out. The three can differ by tens of billions.
- Grant or loan. A grant is a gift; a loan has to be repaid, by Ukraine or — in the case of some EU and G7 loans — from Russian money or Russian reparations.
- Spent where. Aid “for Ukraine” is often spent in the donor country, for example on replacing weapons from a donor’s own stocks.
- Current or constant prices. Comparisons over years use prices adjusted for inflation where the sources provide them; the base year is always given.
- Measured or estimated. Official statistics, company accounts and court decisions are distinguished from estimates by analysts, campaign groups and leaked documents, which are attributed.
The report first traces the money before 2014 and from 2014 to 2021 (sections 2 and 3), then follows each flow: war budgets and rearmament (sections 4 and 5), Russia’s finances and trade (6 and 7), Ukraine’s finances and the aid (8 and 9), the earners (10 to 12), reconstruction (13), who bears the cost (14) and popular claims (15). The history of the war itself is covered in Countersigned’s report “Russia and Ukraine: history, war, diplomacy and prospects” of 28 September 2026.
2. Before 2014: gas, middlemen and a loan from Moscow
Long before the war, the main money flow between Russia and Ukraine was gas. In 2004 more than 80 per cent of Russian gas exports to Europe passed through Ukraine (S001). Ukraine earned transit fees, and like other former Soviet republics it paid Russia a fraction of the price charged in Europe (S001). Neither side was satisfied, and the price became political.
Until 2008 the gas was not sold directly. Intermediary trading companies stood between Gazprom and Ukraine — Itera from 1998, Eural Trans Gas from 2003 and RosUkrEnergo (RUE) from 2005 — and were “long criticized” for their opacity (S002). According to the Oxford Institute for Energy Studies, RUE was owned 50 per cent by Gazprom, whose stake had formerly been held by Gazprombank, 45 per cent by the Ukrainian businessman Dmytro Firtash and 5 per cent by Ivan Fursin (S002); an account by the same institute from 2006 had named Gazprombank and a subsidiary of Austria’s Raiffeisen Bank as the owners (S001). The Jamestown Foundation reported allegations of links to organised crime, which Firtash denied (S194). The middlemen earned a share of the profits from shipping gas from Turkmenistan to Ukraine (S002).
Prices rose in two crises. On 1 January 2006 Gazprom cut off supplies to Ukraine after demanding “European prices” of USD 160 to 230 per thousand cubic metres; Ukraine had offered at most USD 80 (S001). In January 2009, after a dispute over prices and debts, supplies to Ukraine were cut on 1 January and those to 16 EU member states were halted completely from 7 January; for two weeks in mid-winter about 20 per cent of Europe’s gas was cut off (S002). The settlement removed RosUkrEnergo from the trade and tied Ukraine’s price to a European formula: USD 360 per thousand cubic metres in the first quarter of 2009 (S002; S193). Ukraine’s average import price had been USD 50 in 2003 and 2004 (S002).
The gas price was also traded against Crimea. Under the Kharkiv agreements of April 2010, President Viktor Yanukovych extended the lease of Russia’s Black Sea Fleet base in Sevastopol from 2017 to 2042; in return Russia granted a gas discount “equivalent to the $97 million yearly rent” (S284). The discount was 30 per cent of a moving benchmark; the import price nevertheless rose from USD 234 in June 2010 to USD 430 in January 2013 (S284). In 2012 Yanukovych’s own prime minister, Mykola Azarov, said “there actually was no reduction of the price” (S285).
The last money deal before the war was made in December 2013, after Yanukovych had refused to sign an association agreement with the EU. Russia agreed to buy USD 15 billion of Ukrainian bonds from its National Welfare Fund and to cut the gas price from about USD 400 to USD 268.5 (S286; S287). President Putin said the offer was “not tied to any conditions” (S286). Russia transferred the first USD 3 billion on 24 December 2013 (S344). Two months later Yanukovych fled; the USD 3 billion bond became the subject of a lawsuit in London (section 12).
3. 2014–2021: the first phase of the war in money
Russia’s annexation of Crimea and the war in the Donbas from 2014 created new money flows on both sides, though on a far smaller scale than after 2022.
What Crimea cost Russia. Russia’s federal programme for the development of Crimea and Sevastopol was adopted in August 2014 and extended to 2025. According to the Ukrainian monitoring group BlackSeaNews, its planned funding stood at 1,373.6 billion roubles in April 2021, with most of it coming from the federal budget; about 63 per cent was earmarked for transport links, including the bridge across the Kerch Strait (S291). Citing the Russian statistics office, the group reports that two thirds of fixed investment in Crimea during the occupation was paid for by the state budget, and it calls the peninsula “a financial burden” for Russia — an assessment, not a measured fact (S291).
Paying for the occupied Donbas. How much Russia spent on the self-proclaimed “people’s republics” of Donetsk and Luhansk is not documented in official sources. In 2016 the German tabloid Bild estimated that Russia paid about EUR 79 million a month for salaries and pensions there, about one billion euros a year (S237). A former separatist official told Reuters the same year that Russia financed pensions and state salaries; the Kremlin denied it (S236). Both are uncorroborated claims. What is documented is that the separatist authorities seized Ukrainian companies. After Ukrainian activists blockaded trade with the occupied areas, the Luhansk “republic” took over three coal companies of Rinat Akhmetov’s Metinvest and DTEK groups on 1 March 2017, placing them under “temporary administrations” (S346).
Western support for Ukraine. Before 2022, Western aid to Ukraine consisted mainly of loans and modest military help. According to the European Commission, the EU and European financial institutions allocated more than EUR 17 billion in grants and loans from 2014, including EUR 5.6 billion in five macro-financial assistance programmes to support a broad reform agenda (S345). The United States provided non-lethal equipment after 2014 and announced its readiness to supply lethal weapons in 2017 (S014); Ukraine’s first Javelin anti-tank missiles, 210 of them sold in 2018, were paid for partly with US military financing and partly with Ukraine’s own money (S011). From 2014 until the full-scale invasion, US security assistance amounted to roughly USD 2.6 to 2.8 billion. This is the difference between the published totals “since 2014” and “since February 2022” in reports of the Congressional Research Service and the State Department (S343; S288; S011). The first of the presidential drawdowns — transfers of weapons from US stocks — that the State Department counts for Ukraine was authorised in August 2021, for USD 60 million (S288).
Defence budgets. Ukraine increased its military spending after 2014, but from a low base: according to SIPRI, it rose from 2.4 per cent of GDP in 2013 to 3.4 per cent in 2021, or from USD 3.7 billion to USD 6.7 billion at constant 2024 prices (S340). In 2021 Russia spent about ten times as much. Its military spending peaked in 2016 at USD 80.5 billion and then fell back to USD 68.5 billion in 2021, 3.6 per cent of GDP (S340).
4. What Russia and Ukraine spend on war
Measured in money, the war has turned both countries into military economies, but in very different proportions. The Stockholm International Peace Research Institute (SIPRI), which compiles comparable figures for all countries, estimates Russia’s military spending in 2025 at USD 190 billion at current prices, 5.9 per cent more in real terms than a year earlier and the slowest growth since 2022. That is 7.5 per cent of Russia’s economic output (gross domestic product, GDP) and 20 per cent of all government spending, the highest share SIPRI has ever recorded for Russia (S117). Ukraine spent an estimated USD 84.1 billion, 20 per cent more than in 2024: 40 per cent of its GDP and 63 per cent of government spending, the highest shares in the world for the fourth year in a row (S117). Adjusted for inflation, Russia’s spending in 2025 was 2.3 times its 2014 level and Ukraine’s 17.6 times (S340).
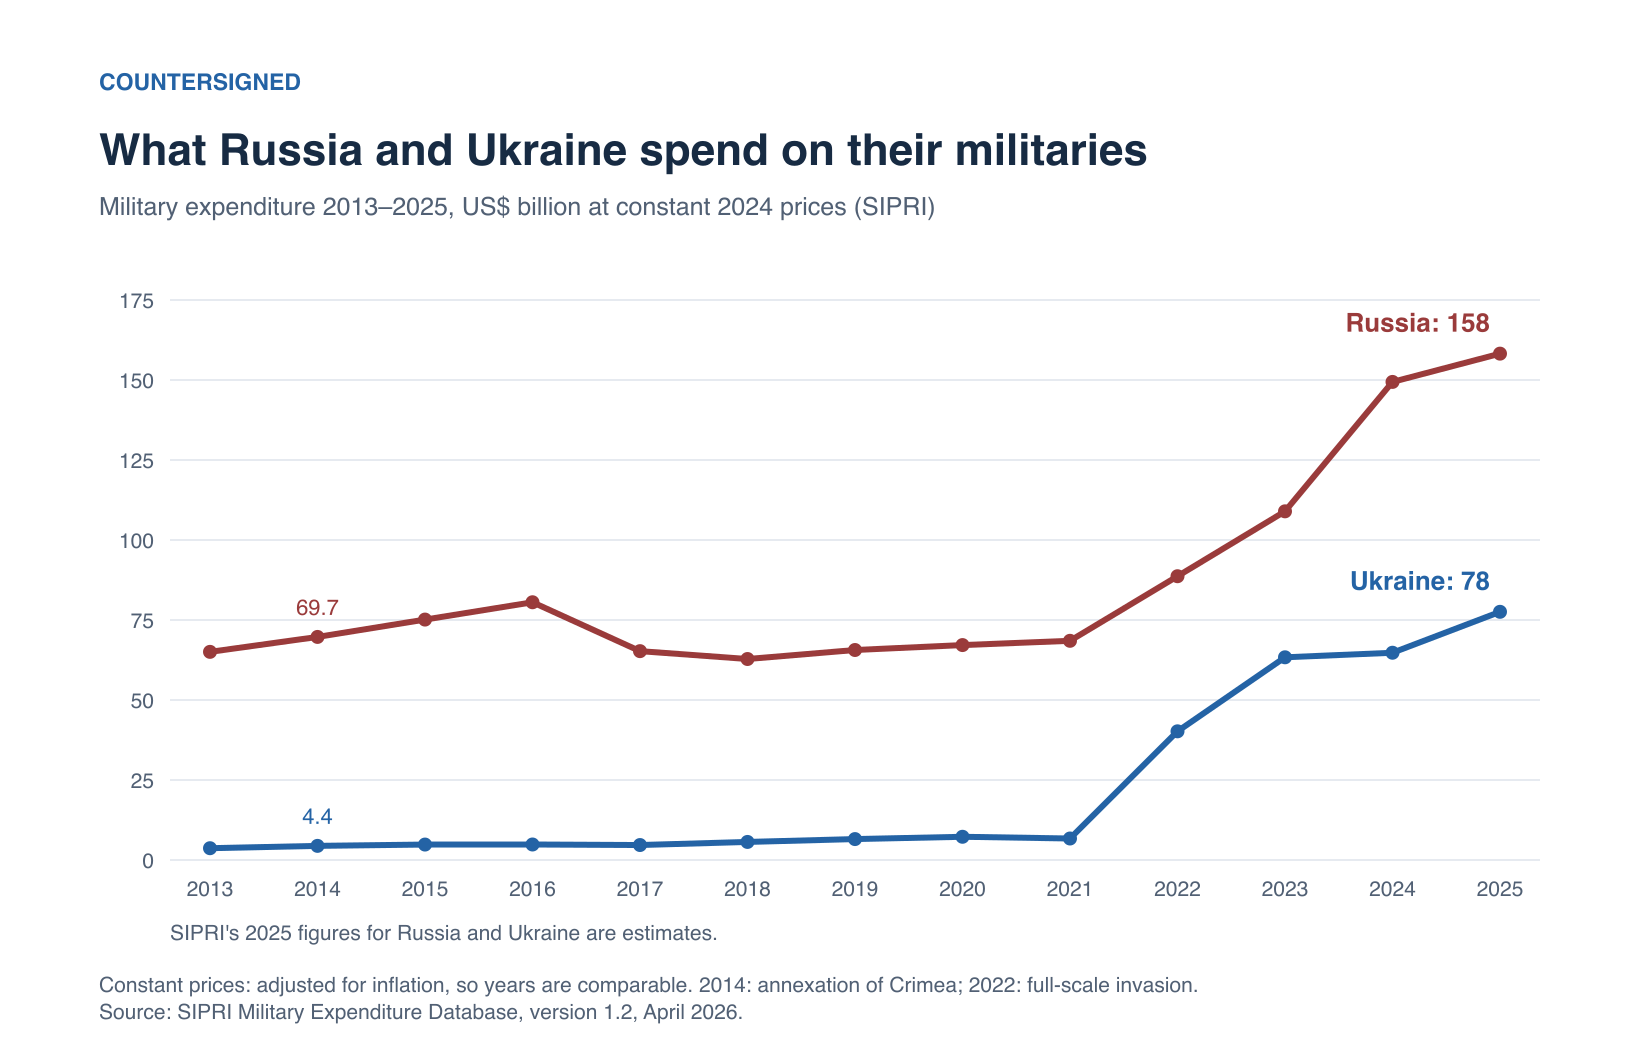
The chart uses constant 2024 prices and exchange rates, in which Russia’s 2025 spending amounts to USD 158 billion and Ukraine’s to USD 78 billion (S340). SIPRI’s figures differ from the national budgets because SIPRI applies one definition to all states, including, for example, military pensions and paramilitary forces that Russia books outside its defence budget (S081).
Russia: a budget that hides its largest item
Russia’s federal budget law for 2026, signed by President Putin on 28 November 2025, cut the “national defence” chapter by 4 per cent in nominal terms — the first announced reduction since the full-scale invasion (S075). The draft put it at 12.93 trillion roubles (about EUR 133.5 billion); together with internal security, police and secret services, the total was 16.84 trillion roubles, 38 per cent of federal spending (S126). The 2025 budget had raised the defence chapter by 52 per cent to 13.5 trillion roubles, 6.3 per cent of GDP; before the war it averaged about 3.1 per cent (S081). The Centre for Eastern Studies (OSW) in Warsaw warns that actual spending “often diverges significantly” from the plan and that the announced cut “may not materialise” (S075).
Much of the money is secret. According to the RAND Corporation, nearly 80 per cent of the national-defence chapter is classified, and since 2022 the finance ministry has stopped publishing detailed monthly expenditure (S081). OSW estimates that about a quarter of all federal spending is classified, more than 80 per cent of it for military purposes (S075). Social policy, education and health together account for about 24.4 per cent of the 2026 budget, a third less than before the invasion (S075).
The war has opened a gap in the budget. In the first eight months of 2026 the deficit already reached 5.8 trillion roubles, against 3.8 trillion planned for the whole year (S112). For 2027 to 2029 the government’s draft foresees deficits of about 2 per cent of GDP each year, nearly 16 trillion roubles in total (S124). Reuters, which reviewed the draft, reported “record military spending of 17.1 trillion rubles” for 2027; it is not clear from the reporting whether this figure includes internal security (S124). The finance ministry describes its strategic priority as financing “defense and security needs” and support for participants of what Russia calls the “special military operation” and their families (S080).
Ukraine: two thirds of the budget for defence
Ukraine’s 2026 budget law set aside UAH 2.8 trillion (hryvnia; about USD 66.4 billion), about 27 per cent of GDP, for defence and security; almost UAH 1.3 trillion was for soldiers’ pay and UAH 709.8 billion for weapons and equipment (S100). In June 2026 parliament added UAH 1.56 trillion, lifting defence and security spending to a record UAH 4.4 trillion; according to the defence ministry, UAH 2.3 trillion of it is for weapons and more than UAH 1.45 trillion for pay (S133). The increase was made possible by a EUR 90 billion loan from the EU, of which EUR 60 billion is earmarked for defence (S133).
The draft budget for 2027, approved by the government in September 2026, allocates UAH 4.89 trillion (about USD 109.6 billion) to defence and security — nearly 44 per cent of GDP and about two thirds of all budget spending (S084; S083). Ukraine’s own revenues cannot cover this: the draft expects domestic revenue of UAH 3.2 trillion, and the gap of more than UAH 1.6 trillion is to be covered by international partners (S083). The finance ministry puts Ukraine’s need for international support in 2027 at USD 52.6 billion; according to the chair of the parliament’s budget committee, partners had confirmed only USD 20 billion by mid-September 2026 (S083). Ukraine’s finance minister says that “all possible domestic state resources” go first to defence (S083). Foreign aid, according to the Centre for Economic Strategy in Kyiv, cannot pay soldiers directly but “frees domestic resources” for that purpose (S101).
In this report’s assessment, the two budgets show the asymmetry of the war’s finances. Russia spends more than twice as much as Ukraine, at a fraction of its economic output, and pays from its own revenue, taxes and borrowing. Ukraine spends a larger share of its economy than any other country, which it can sustain only because foreign governments and institutions cover almost half of its overall budget needs and supply much of its weapons (section 8) (S100).
5. The world rearms: NATO, Russia, China and others since 2014 — and where the money goes
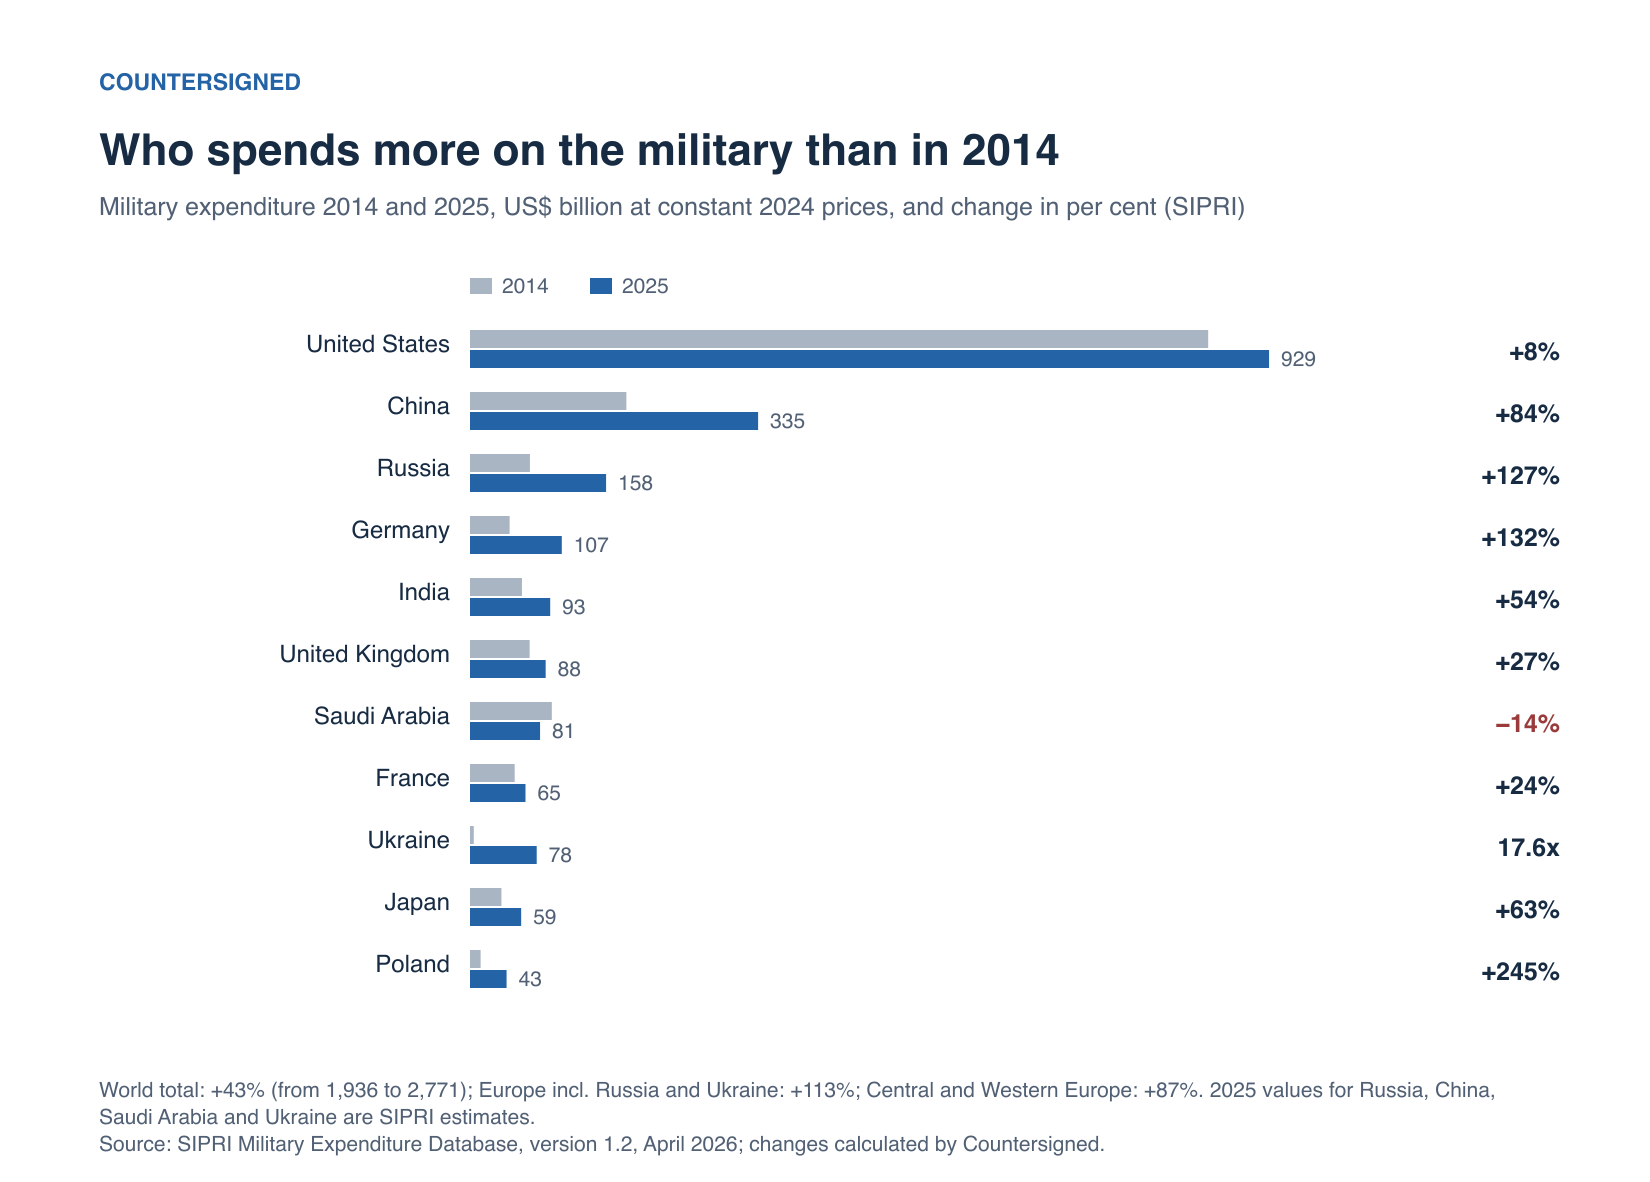
Russia’s war against Ukraine is the largest single driver of a worldwide increase in military spending, but not the only one. According to SIPRI, world military expenditure rose for the eleventh year in a row in 2025, to USD 2,887 billion at current prices, 2.5 per cent of global GDP (S117). At constant prices, the world total has risen by 43 per cent since 2014, from USD 1,936 billion to USD 2,771 billion (in 2024 dollars) (S340). Spending in Europe more than doubled over the same period, from USD 372 billion to USD 791 billion at constant prices; this regional total includes Russia and Ukraine, and in Central and Western Europe alone spending rose by 87 per cent, from USD 293 billion to USD 547 billion (S340); SIPRI attributes the European increase to “the growing geopolitical instability in the region, mainly related to the Russia–Ukraine War”, and to uncertainty about US security guarantees (S117).
Who spends more
The five biggest spenders in 2025 were the United States, China, Russia, Germany and India, together 58 per cent of the world total (S117). Their paths since 2014 differ (calculated from SIPRI data at constant prices, S340):
- United States: USD 954 billion in 2025, 8 per cent more than in 2014 in real terms. In 2025 US spending fell by 7.5 per cent, “primarily” because no new military assistance for Ukraine was approved, after USD 127 billion in the previous three years (S117; S118). SIPRI counts such aid as spending of the donor country (S117).
- China: an estimated USD 336 billion, 84 per cent more than in 2014; in 2025 it rose by 7.4 per cent (S117).
- Russia: an estimated USD 190 billion, 127 per cent more than in 2014 (section 4). Adjusted for purchasing power — what a dollar buys in Russia — the International Institute for Strategic Studies (IISS) estimated Russia’s 2024 spending at nearly USD 462 billion, “effectively leapfrogging Europe’s collective spending”; lower domestic costs explain “why Russia is able to fund so much more” (S136).
- Germany: USD 114 billion, 132 per cent more than in 2014. In 2025 it exceeded 2 per cent of GDP for the first time since 1990, and military spending above 1 per cent of GDP was exempted from Germany’s “debt brake”, its legal limit on borrowing (S117).
- Poland: USD 46.8 billion, 245 per cent more than in 2014 and 4.5 per cent of GDP, the highest share in NATO (S117; S340).
- India and Japan increased their spending by 54 and 63 per cent respectively; in India’s case SIPRI notes that the conflict with Pakistan in May 2025 “pushed up military spending” (S340; S117). Saudi Arabia, by contrast, spent 14 per cent less than in 2014 (S340).
Among these countries, the steepest increases since 2014 are in Ukraine, Poland, Germany and Russia; of those whose spending rose, the United States, by far the largest spender, grew least.
NATO: from 2 to 5 per cent
At their summit in Wales in September 2014, months after the annexation of Crimea, NATO members below the 2 per cent “guideline” agreed to “aim to move towards the 2% guideline within a decade”, and to raise spending on major new equipment to at least 20 per cent of their defence budgets (S325). In 2014 the European members and Canada together spent 1.40 per cent of their GDP on defence; by 2025, according to NATO’s estimates, it was 2.27 per cent (S328). At constant prices their spending roughly doubled, while US spending rose by 13 per cent (S328). SIPRI counted 23 of the 32 members at or above 2 per cent in 2025 (S117). In June 2025, at The Hague, the allies committed to spend 5 per cent of GDP a year by 2035: at least 3.5 per cent on core defence and up to 1.5 per cent on related investment such as infrastructure, networks and the defence industry (S326). Direct contributions to Ukraine’s defence and its defence industry count towards these targets (S333).
Where the money goes: more equipment, much of it American
Most military spending does not go on weapons. SIPRI warns against calling military expenditure “arms spending”, since spending on armaments “is usually only a minority of the total”; the rest pays for personnel, pensions, operations and maintenance (S118). But the share of equipment is rising. According to NATO data, Poland spent 18.8 per cent of its defence budget on major equipment in 2014 and 54.4 per cent in 2025; the United Kingdom raised the share from 22.8 to 36.0 per cent, France from 24.6 to 31.0 per cent and Germany from 12.9 per cent to 21.2 per cent by 2024 (S328). In the EU, defence investment — research, development and procurement — reached a record EUR 72 billion in 2023, and procurement spending has more than doubled since 2014 (S330).
A large part of these purchases goes to the United States. Arms imports by European states more than trebled between 2016–20 and 2021–25; according to SIPRI, which measures deliveries of major weapons rather than contract values, 48 per cent came from the United States, and for the 29 European NATO members the US share was 58 per cent (S155). For the first time in two decades, Europe received the largest share of US arms exports (38 per cent), and the United States accounted for 42 per cent of world arms exports (S155). The European Defence Agency notes that member states “frequently resorted” to off-the-shelf products from non-European manufacturers to fill gaps quickly, “weakening” Europe’s own defence industry (S330). Poland illustrates the pattern: its arms imports rose more than ninefold, with 47 per cent from South Korea and 44 per cent from the United States (S155). In the 2025 US fiscal year, US arms sales abroad totalled USD 331.18 billion, according to State Department figures reported by Defense Archives (S339).
The EU is trying to keep more of the money in Europe. Under its “ReArm Europe” plan, member states aim to mobilise EUR 800 billion for defence (S045), including EUR 150 billion of EU loans under the SAFE programme (Security Action for Europe) (S045). Poland was allocated the largest share, EUR 43.7 billion (S336); loans are to be approved for spending “which supports the European defense industry and promotes joint procurement between states”, according to the EU defence commissioner (S337). Russia, meanwhile, has lost market share: its share of world arms exports fell from 21 to 6.8 per cent between 2016–20 and 2021–25, largely because of lower exports to Algeria, China and Egypt (S155). Ukraine became the world’s largest arms importer, with 9.7 per cent of all imports in 2021–25; its main suppliers were the United States (41 per cent), Germany (14 per cent) and Poland (9.4 per cent) (S155).
6. How Russia pays — and who pays in Russia
Russia finances its war from four sources: revenue from oil and gas, taxes paid by its own companies and citizens, savings and borrowing, and — according to one analyst — credit that banks must grant to arms makers. The burden has shifted over time from export revenue to the Russian public.
Oil, taxes and savings
Oil and gas are the largest single source, but taxes on the rest of the economy together bring in more. According to Finance Ministry data reported by Reuters, the federal budget’s oil and gas revenue fell by 24 per cent in 2025, to 8.48 trillion roubles from 11.13 trillion in 2024, the lowest level since 2020, because oil prices fell and the rouble strengthened; it makes up “a quarter of federal budget proceeds” (S309). In January to November 2024, according to bne IntelliNews, non-oil revenue was about twice as large as revenue from oil and gas (S127). Russia raised value-added tax (VAT), the tax added to the price of most goods and services, from 20 to 22 per cent from January 2026, despite earlier promises not to raise taxes until 2030 (S230). According to Meduza’s account, the Finance Ministry made no secret that the 4.4 trillion roubles it expects to raise in this way over three years “will go toward military spending and security forces” (S230). Alexandra Prokopenko of the Carnegie Endowment concluded that the government finds it “more convenient” to pay for the war “out of the pockets of the general public and businesses” (S113).
The savings cushion has shrunk. The liquid part of the National Wealth Fund, Russia’s reserve fund, halved from 9 trillion roubles before the war to 4.8 trillion in 2023, according to bne IntelliNews (S127). A further large part of Russia’s reserves held abroad is frozen in the West (section 12). The deficit widened: in September 2025 the government expected a deficit of 5.7 trillion roubles for 2025, 2.6 per cent of GDP, nearly five times what the budget law had planned (S230). For 2026 it plans 3.8 trillion roubles (S230).
The war has fuelled inflation, which is itself a tax on savers. The central bank raised its key interest rate from 7.5 per cent in July 2023 to a record 21 per cent by October 2024 (S307). It has since cut the rate to 14 per cent by July 2026; inflation fell to 5.6 per cent at the end of 2025 and stood at 6.3 per cent in early September 2026 (S229; S074). Growth has stalled: after 4.1 per cent in 2023 and 4.3 per cent in 2024 (S230), the economy grew by 1.0 per cent in 2025, and the central bank expects 0 to 1 per cent for 2026 (S229).
The hidden budget: credit for arms makers
Part of Russia’s war spending may not appear in the budget at all. The American analyst Craig Kennedy, a former investment banker now at Harvard’s Davis Center, argues that under a law of February 2022 the state directs Russia’s major banks to give arms makers and other war-related companies loans on preferential terms (S307). From July 2022 to November 2024, Russian companies took on 36.6 trillion roubles of additional debt — 21.3 per cent of 2023 GDP. Kennedy estimates that the war-related share of this lending equals 72 to 118 per cent of the official defence budget for the same period (S307). (An earlier, widely quoted figure of USD 210 to 250 billion comes from his social-media post (S127).) Kennedy himself notes that the data are “not sufficiently granular” for precise estimates and that some of the extra borrowing is certainly not war-related (S307). bne IntelliNews, which first reported Kennedy’s figures, noted that other economists consider Russia’s economy “a lot more robust than it looks”, that the formal budget, not bank loans, remains the main source of defence funding, and that bad loans were only about 4 per cent of the banks’ loan book (S127). In this report’s assessment, the existence of state-directed lending is documented; its size remains an estimate.
According to Prokopenko, a significant part of military funding also comes through regional programmes, state-guaranteed loans to defence companies and purchases through state corporations (S113).
Who is paid: soldiers and their families
Some of the money ends up in the hands of ordinary Russians, chiefly soldiers recruited with high payments. The research group Re:Russia estimated that budgets at all levels spent about 2 trillion roubles on military personnel in the first half of 2025: about 400 billion roubles on signing bonuses, about 860 billion on pay and 750 to 760 billion on payments to families of the killed and wounded (S310). At that rate, the total for 2025 would reach 4 trillion roubles, 2 per cent of GDP (S310). An earlier Re:Russia estimate found that these incomes played “a significant role” in sustaining consumption and savings (S312). Regions compete for recruits with one-off payments: in July 2026 Khanty-Mansi offered the largest, 4.1 million roubles including federal and municipal money (S227). From autumn 2025 several regions cut their payments, and, according to former president Dmitry Medvedev, about 200,000 people signed contracts in the first half of 2026, down from more than 210,000 a year earlier (S313; S227). The economist Vladislav Inozemtsev called this system “deathonomics” (S226): in his calculation, the legal payouts to the family of a mobilised soldier killed after five months amounted to 31 years of a low regional salary (S226).
Who profits at the top
Russia’s richest have not become poorer. Forbes counted a record 155 Russian billionaires in 2026, the fourth consecutive increase, with a combined wealth of USD 695.5 billion; Forbes attributes part of the increase to the stronger rouble (S231). The list is led by owners of steel, nickel and oil companies, and the sources do not show how much of their wealth comes from the war. The state’s arms makers are less profitable than their order books suggest: the head of Rostec, Sergei Chemezov, reported a 25 per cent rise in revenue in 2025 but a 42 per cent fall in net profit, and said that state defence contracts yield a margin of about 2 per cent (section 10) (S165; S166).
Corruption is part of the picture. In July 2025 a Moscow court sentenced the former deputy defence minister Timur Ivanov to 13 years in prison for embezzlement and money laundering (S063; S064). Private contractors also earned: President Putin said in June 2023 that the Wagner group had received more than 86 billion roubles from the state budget in a year, and that Yevgeny Prigozhin’s catering company Concord had earned 80 billion roubles supplying the army (S085). The US Treasury said Wagner companies financed the group with “illicit gold dealings” in Africa (S232).
7. Russia’s suppliers and customers: what they earn
Russia’s war economy depends on partners who buy its raw materials and sell it what sanctions deny it. They earn from both sides of the trade.
China: the main supplier of controlled goods
China is the most important source of the goods that Russia’s arms industry needs — components that can be used for both civilian and military purposes, such as microchips and machine tools. According to an analysis published by the Carnegie Endowment, China supplied about 90 per cent of Russia’s imports of goods on the G7’s “high priority” export-control list in 2023; in 2021 it had been 32 per cent (S038). A staff report of the US-China Economic and Security Review Commission, set up by the US Congress, found that Chinese firms made 49 per cent of these items and that a further 16 per cent came from factories in China owned or operated by Western companies (S035). Trade between the two countries reached USD 245 billion in 2024, twice the 2020 value, and by early 2024 more than 90 per cent of it was settled in roubles or yuan (S035).
China earns well from this position. According to the Kyiv School of Economics (KSE), the premium Russia pays China for such goods rose with China’s share of supply and reached “approximately 300%” in 2025, while the premium across all suppliers combined stayed below 50 per cent for most of the war (S040). KSE’s figures come from a summary of its tracker; the method is not described there. China is also Russia’s largest oil customer: in 2024 Russia supplied 2.2 million barrels a day, 21.5 per cent of China’s crude imports, against 15.5 per cent before the war (S035).
India, Türkiye and the trade in refined oil
According to the Centre for Research on Energy and Clean Air (CREA), a Finnish research organisation that tracks Russian exports by ship, China had bought 50 per cent of Russia’s crude exports since December 2022, India 37 per cent, and Türkiye and the EU 5 per cent each by the end of August 2026 (S341). India’s case shows what buyers gain. Russian oil made up about 2.5 per cent of India’s imports before 2022 and 35.8 per cent in the fiscal year 2024–25; according to an analysis by Carnegie India, the discounts “allowed Indian refiners to benefit by approximately $12.2 per barrel” (S043). Part of the fuel was resold: according to CREA, cited by the US broadcaster NPR, the United States bought an estimated USD 1.4 billion of Indian oil products in the first seven months of 2025, more than 90 per cent from the refinery of Reliance Industries, which gets nearly half its crude from Russia (S044). In August 2025 the United States imposed an additional 25 per cent tariff on Indian goods as a penalty for these purchases, doubling the tariff to 50 per cent (S043; S044); according to CNBC, the tariffs were reduced to 18 per cent in 2026, and in June and July 2026 Russia supplied more than half of India’s oil imports (S104).
The EU has tried to close the “refining loophole”. Since 21 January 2026 it has banned imports of oil products made from Russian crude, but CREA counted twenty “high risk” shipments from refineries using Russian crude that were unloaded at EU ports in August 2026 (S341). Türkiye is the largest buyer of Russian oil products, with 26 per cent of exports since December 2022 (S341). Another war has helped Russia: according to CREA, in the six months after US and Israeli strikes on Iran drove up oil and gas prices — a period CREA calls the “Hormuz energy crisis” — Russia’s seaborne export revenues rose by an estimated USD 35.9 billion (S341).
The shadow fleet and those who sold it
To keep selling oil above the price cap that Western countries impose, Russia built a “shadow fleet” of ageing tankers with opaque ownership and no reliable Western insurance. According to the Brookings Institution, it grew from fewer than 100 vessels in February 2022 to 343 in April 2025 (S186). The tankers had to come from somewhere. An investigation by Follow the Money and the Organized Crime and Corruption Reporting Project (OCCRP) found that Western shipowners earned more than USD 6.3 billion selling ageing tankers that became part of a shadow fleet of around 600 ships; more than half of the tankers it identified were sold by 54 Greek-operated companies for at least USD 3.7 billion (S187). Such sales were legal: direct sales to Russian entities have been banned since 2023, but indirect sales to buyers in non-sanctioning countries are not (S187). Western countries have since sanctioned 565 vessels, according to CREA (S176), yet in August 2026 sanctioned “shadow” tankers carried 52 per cent of Russia’s seaborne oil (S341).
North Korea and Iran: paid in kind and in gold
North Korea supplies ammunition and soldiers. According to the Multilateral Sanctions Monitoring Team (MSMT), a group of states that monitors the UN sanctions on North Korea and bases its report primarily on information from its participating states, North Korea delivered as many as 9 million rounds of artillery and rocket ammunition in 2024 and at least 100 ballistic missiles, and deployed more than 11,000 troops in late 2024 (S028). In return, Russia is believed to have supplied air-defence equipment and refined oil beyond what is reported to the UN, and to let North Korea pay through UN-designated banks using rouble accounts (S028). Leaked Russian records obtained by OCCRP show how intermediaries profit: a Moscow fuel trader that supplied North Korea by rail saw its revenue jump from just under 900 million roubles to 18 billion roubles in 2024 (S233).
Iran supplied the design for Russia’s mass-produced combat drones. According to documents from hacked servers of an Iranian front company, published in Ukraine in February 2024, the production contract for Shahed-136 drones, including technology transfer and 6,000 kits, was worth USD 1.75 billion, and “Russia is at least partially paying Iran in gold” (S235). These documents have not been independently authenticated in the sources reviewed. The US Treasury said in 2024 that Russia and Iran’s defence ministry cooperated “to finance and produce” the drones in Russia’s Alabuga economic zone (S033).
Re-exports and new payment channels
Western goods still reach Russia through third countries. EU data cited in the EU’s twentieth package of sanctions against Russia show that imports of high-priority items from the EU into Kyrgyzstan rose by 800 per cent after 2022, and exports of the same items from Kyrgyzstan to Russia by 1,200 per cent (S109). Kyrgyzstan’s president rejected the EU’s sanctions as based on “false information” (S108). Payments, too, have found new routes, including A7A5, the rouble-linked stablecoin described in section 12, whose issuer is 51 per cent owned by the sanctioned Moldovan businessman Ilan Shor, with the Russian state-owned Promsvyazbank as its other major shareholder (S219).
8. How Ukraine pays: its own revenue, donors and loans
Ukraine pays for its army mainly itself and borrows or receives grants for almost everything else. In 2025, according to the Kyiv School of Economics (KSE), domestic revenue (excluding foreign grants) covered only 60 per cent of budget spending: USD 78.9 billion of revenue against USD 131.3 billion of spending, of which USD 73.6 billion went to defence (S276). The gap is filled by foreign governments and institutions — in part as grants that do not have to be repaid, increasingly as loans that do.
How much, from whom
The most complete independent count is kept by the Kiel Institute for the World Economy. It records government-to-government aid — military, financial and humanitarian — from 41 countries and the EU institutions, valued at market prices and, where estimates are needed, at the upper end (S004). It distinguishes between promises (commitments) and aid that has been delivered or earmarked for delivery (allocations) (S009). As of April 2024, the EU had committed more than EUR 152 billion but allocated EUR 87 billion (S009).
The balance between America and Europe has reversed. In March and April 2025 Europe overtook the United States in total military aid for the first time since June 2022, with EUR 72 billion against EUR 65 billion, because Washington had announced no new aid since early January 2025 (S008). In 2025 American aid fell by 99 per cent, while Europe increased its allocations by 59 per cent for financial and humanitarian aid and by 67 per cent for military aid compared with the 2022–24 average, so that total aid remained close to previous years (S115). By the end of February 2026 the United States had allocated EUR 64.6 billion in military aid; the largest donors outside the EU were the United Kingdom (EUR 20 billion in allocated aid), Canada (EUR 14 billion), Japan (EUR 11 billion) and Norway (EUR 10 billion) (S010). The European Commission puts the total support of the EU and its member states since 2022 at EUR 224.5 billion as of September 2026 (S022).
Since 2025 the United States has sold weapons rather than donated them. Under NATO’s PURL initiative (Prioritized Ukraine Requirements List), launched in July 2025, Europeans and Canada pay for American weapons for Ukraine (S018): in 2025 donors bought US weapons worth EUR 3.7 billion this way, including HIMARS rocket launchers and Patriot air-defence systems (S115). In the first half of 2026 European donors bought military aid worth at least EUR 3 billion from US defence companies (S114).
Grants and loans: who will repay
How the aid is given decides who ultimately pays for it. According to Kiel Institute data cited by the European Parliament’s research service, about 82 per cent of EU assistance comes as loans on highly favourable terms, while US support “mostly came as non-repayable grants” (S010). Three loan programmes stand out.
- The Ukraine Facility, worth up to EUR 50 billion for 2024 to 2027, consists of EUR 33 billion in loans and EUR 17 billion in grants (S020). Payments are made quarterly if Ukraine completes agreed reforms; by June 2026 the EU had disbursed more than EUR 29.5 billion (S019). In April 2026 EUR 1.18 billion was held back because nine reform steps were outstanding (S010).
- The ERA loans (Extraordinary Revenue Acceleration) of the G7, about USD 50 billion, are serviced and repaid from the interest earned on immobilised Russian assets (S026); the EU contributed EUR 18.1 billion and the United States USD 20 billion (S027). Repayment is “at no cost to Ukraine”, according to the European Parliament’s research service (S010); if Russian proceeds fall short, however, the outstanding balance must be repaid by Ukraine (S027).
- The EUR 90 billion Ukraine Support Loan for 2026 and 2027 is split into EUR 30 billion for the budget and EUR 60 billion for Ukraine’s defence industry and arms purchases. Ukraine has to repay it only if it receives reparations from Russia; otherwise the EU reserves the right to use frozen Russian central-bank assets to settle the claims (S098; S097). It is financed by joint EU borrowing (S097), and the EU budget covers the interest, estimated at around EUR 1 billion in 2027 and EUR 3 billion a year from 2028 (S010). The money is to buy defence products from industries in Ukraine, the EU and the European Economic Area, or from third countries that have concluded an agreement with the EU under its SAFE defence-loan regulation or meet other conditions; exceptions are possible for urgent needs (S098). The first EUR 3.2 billion was paid on 25 June 2026, after Ukraine had met seven conditions, including extending its military levy (S282); by mid-September 2026 the Commission had paid nearly EUR 15 billion to Ukraine in 2026 (S022).
The International Monetary Fund (IMF) adds a smaller but conditional programme: a four-year loan of about USD 8.1 billion approved in February 2026, part of a USD 136.5 billion international support package that the IMF and the Ukrainian government estimate Ukraine needs for 2026 to 2029 (S010; S154).
A state in debt
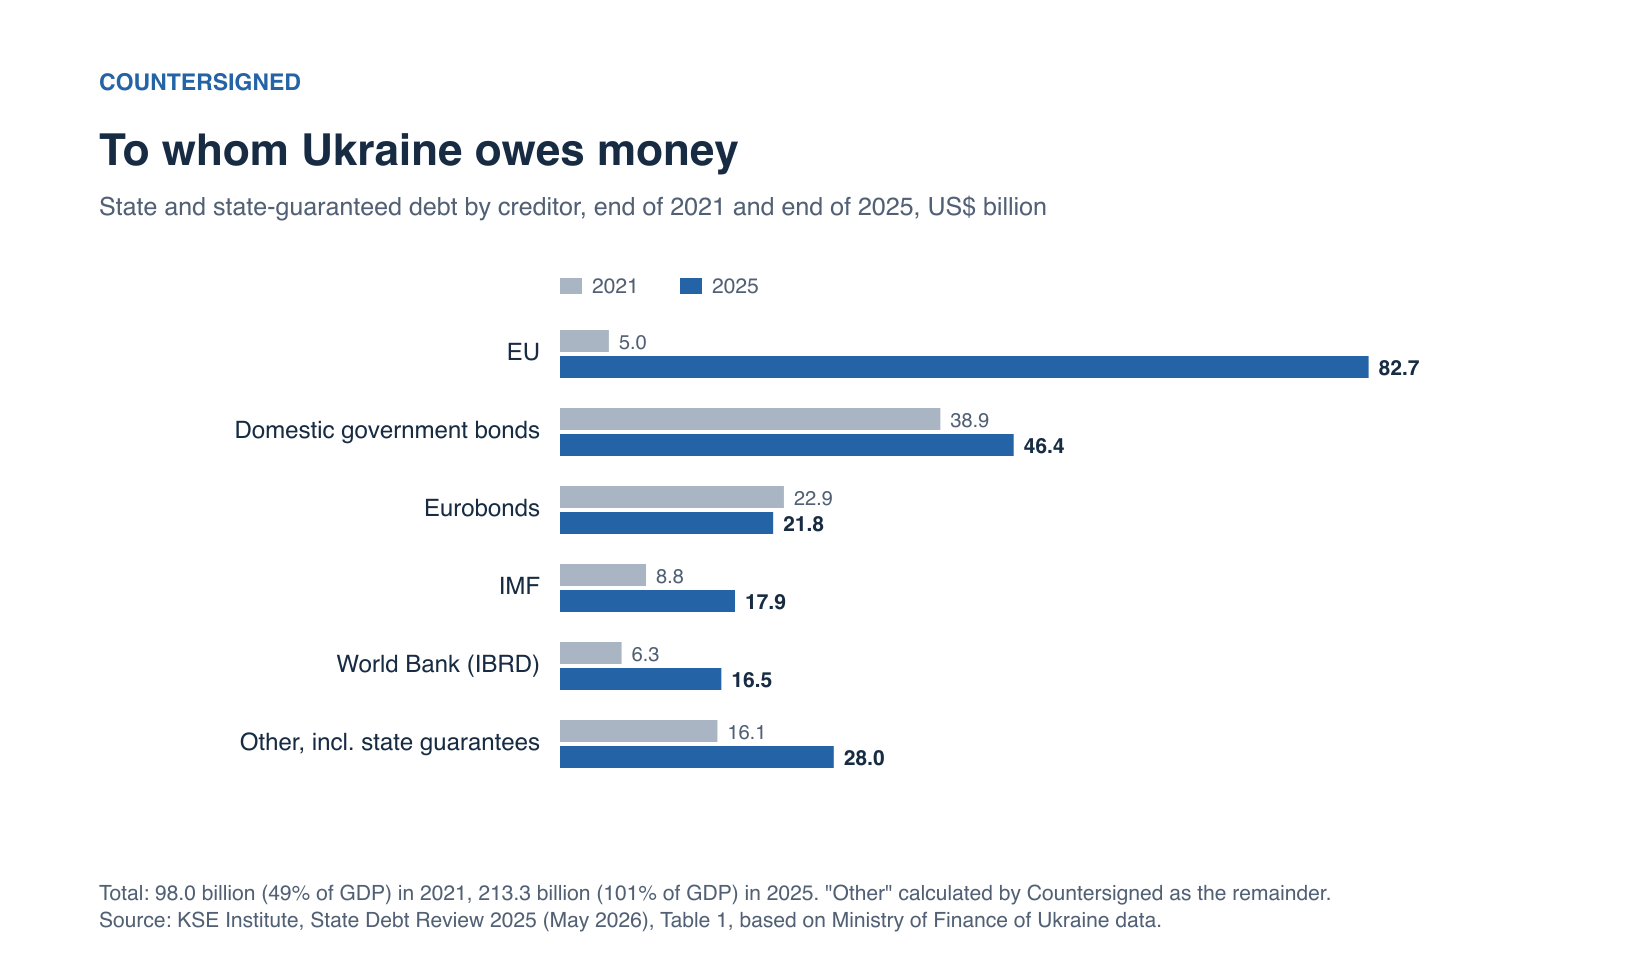
The result is rapidly rising debt. Ukraine’s state and state-guaranteed debt rose from USD 98.0 billion (49 per cent of GDP) in 2021 to USD 213.3 billion (101 per cent of GDP) at the end of 2025, according to KSE (S276). The EU is now by far the largest creditor, with USD 82.7 billion, 38.8 per cent of the total; holders of Ukraine’s international bonds are owed USD 21.8 billion, the IMF USD 17.9 billion and the World Bank’s lending arm USD 16.5 billion (S276). Servicing the debt cost 11 per cent of budget revenues in interest alone in 2025 (S276). The share of the ERA loans, 17.8 per cent of the debt, is to be serviced from Russian asset revenues (S276).
Who pays salaries and pensions
Much Western money does not go to the army at all but keeps the civilian state running. The World Bank’s PEACE project (Public Expenditures for Administrative Capacity Endurance) reimburses the salaries of teachers, doctors and civil servants and social payments; by September 2025 it had disbursed more than USD 41 billion, USD 32 billion of it financed by the United States (S055). The World Bank pays only for expenditure it has checked, recovers ineligible payments, and independent audits “have issued clean opinions” (S055). The US Government Accountability Office found weaknesses in how USAID used the expenditure data, but concluded that the risks are “mitigated by the project’s multi-layered oversight” (S053).
9. Where the aid money goes
“Aid to Ukraine” suggests money sent to Kyiv. Much of it never leaves the donor country: it pays factories at home to replace weapons taken from stocks or to build new ones for Ukraine.
American aid: largely spent in America
The US Congress has made available USD 196.43 billion since February 2022 for the response to the war in Ukraine and related US operations in Europe; by 30 June 2026 USD 180.91 billion had been committed by contract (obligated) and USD 121.16 billion actually paid out (disbursed), according to the inspectors general who oversee the spending (S137). Of the total, USD 142.82 billion was for security assistance, USD 45.69 billion for governance and development and USD 4.13 billion for humanitarian aid and USD 3.80 billion for the agencies’ operations, including oversight (S137). The total includes items that are not aid to Ukraine at all, such as USD 51.08 billion for US forces in Europe under the European Deterrence Initiative (S137).
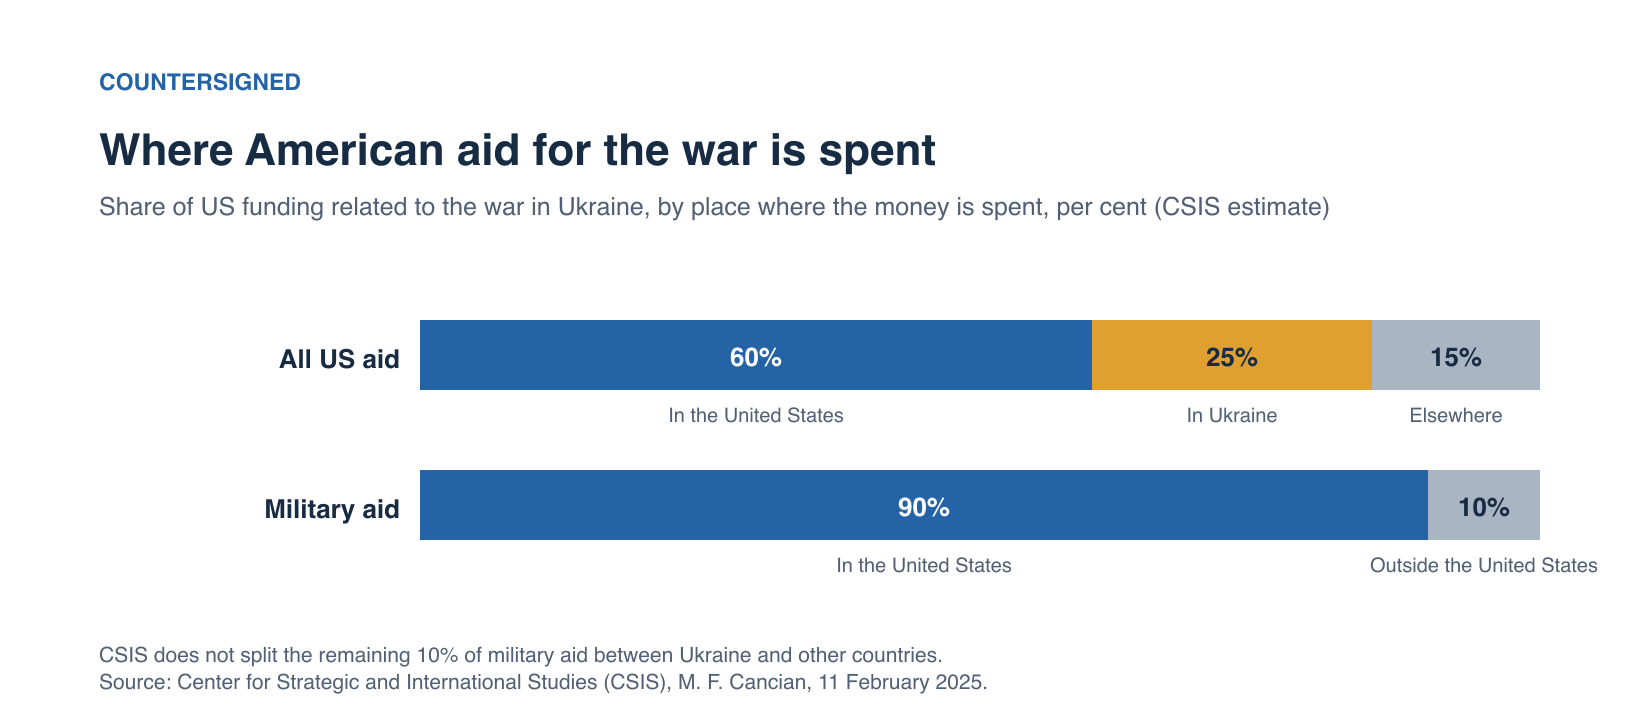
According to an analysis by the Center for Strategic and International Studies (CSIS) in Washington, about 60 per cent of all US aid related to the war is spent in the United States, about 25 per cent in Ukraine and 15 per cent elsewhere; for military aid the share spent in the United States is 90 per cent (S056). Most of the money is not delivered to Ukraine as cash “but handled by trusted agencies, mostly the U.S. military, the Department of State/USAID, and the World Bank” (S056). When President Zelensky said in February 2025 that Ukraine had received only USD 75 billion of the USD 175 billion the United States had spent, CSIS explained the gap in this way rather than as missing money (S056).
Two channels dominate the military money. Under the Presidential Drawdown Authority, the Pentagon handed over weapons from its own stocks — USD 31.7 billion worth from October 2021 to January 2025 (S013) — and Congress then paid to replace them: USD 45.8 billion was appropriated for replenishment (S058). Under the Ukraine Security Assistance Initiative (USAI), USD 31.8 billion was provided to buy newly manufactured weapons for Ukraine (S058); USAI allows contracts directly with US manufacturers “such as Lockheed Martin or RTX” (S057).
The money reached factories across the country. According to the Congressional Research Service (CRS), contract awards and grants related to defence production for Ukraine went to suppliers in at least 38 US states (S058). Pentagon documents reported by Reuters in September 2024 put USD 41.7 billion of purchases, investments and replacements in more than 35 states, led by Pennsylvania (USD 2.52 billion), Arizona (USD 2.02 billion) and Texas (USD 1.85 billion) (S150; S151). CRS lists individual contracts, such as USD 4.5 billion to Lockheed Martin for 870 Patriot interceptors in June 2024, and notes that US output of 155-millimetre artillery shells rose from about 14,400 a month in February 2022 to 40,000 in September 2024 (S058). A CSIS commentary in 2024 called the aid an investment in the US defence industrial base, estimating that as much as USD 68 billion of the USD 113 billion then appropriated was “destined to be invested here at home” (S057).
Since 2025 the flow has changed direction. Under NATO’s PURL mechanism, European allies and Canada pay for US weapons for Ukraine; by July 2026, 29 countries had contributed USD 6.7 billion, according to Ukraine’s defence ministry (S018); this count of contributions is not comparable with the Kiel Institute’s valuation of purchases (section 8). The inspectors general report that the amounts and types of equipment bought this way “are not publicly releasable” (S137).
European aid: from the stockpile to Ukrainian factories
European money follows several routes. The EU’s off-budget European Peace Facility mobilised EUR 6.4 billion for Ukraine between 2022 and 2025, partly to reimburse member states for weapons from their stocks and partly for joint purchases of ammunition from companies in the EU or Norway (S021). The EUR 90 billion loan of 2026 gives Ukraine access “to defence products from both the Ukrainian and EU defence industries”; by mid-August 2026 the EU had disbursed EUR 8.4 billion of it for drones (S021), and in September a further EUR 3.3 billion for drones and missiles (S022).
A growing share is spent in Ukraine itself. Under the “Danish model”, donors pay Ukrainian arms makers directly instead of buying from their own industry; Denmark planned to invest about EUR 1.4 billion this way in 2025 (S146). Ukraine chooses the companies and weapons, and the donor countries audit the manufacturers (S147).
The Czech ammunition initiative: who earned the commissions
The most contested channel is the Czech-led initiative to buy artillery shells on the world market, in which up to 16 European countries joined in 2024 (S148). It managed more than EUR 1.6 billion of European taxpayers’ money by late 2024 (S148). An investigation by Radio Free Europe’s Schemes unit with Czech partners found that all five companies granted exclusive rights to broker the contracts are Czech, that the government held no public tenders and that their commissions are “at least four times higher” than those of Ukraine’s state arms brokers (S148). Government sources put the agreed commission at no more than 13 per cent; the initiative’s envoy calculated 5 to 10 per cent (S148). The two producers among the five are the Czechoslovak Group (CSG) and the STV Group (S148). The investigation found no evidence for allegations of defective shells, but established that deliveries were often late (S148). The Czech foreign minister said the initiative had helped change the ratio of shells fired by Ukraine and Russia from 1:10 to 1:2 (S148).
In this report’s assessment, the documented flows show that a large part of the aid to Ukraine has been spent in the donor countries’ own industries. That is a deliberate policy choice by governments, not concealed profit; whether it is good value is a separate question, on which the Czech case shows that the terms are not always transparent.
10. The defence industry: who earns from weapons
The arms makers are the most obvious commercial winners of the war, and the evidence confirms that they have grown. It also shows that the growth is uneven, that it has several causes besides Ukraine, and that higher revenue has not always meant higher profit.
The global picture
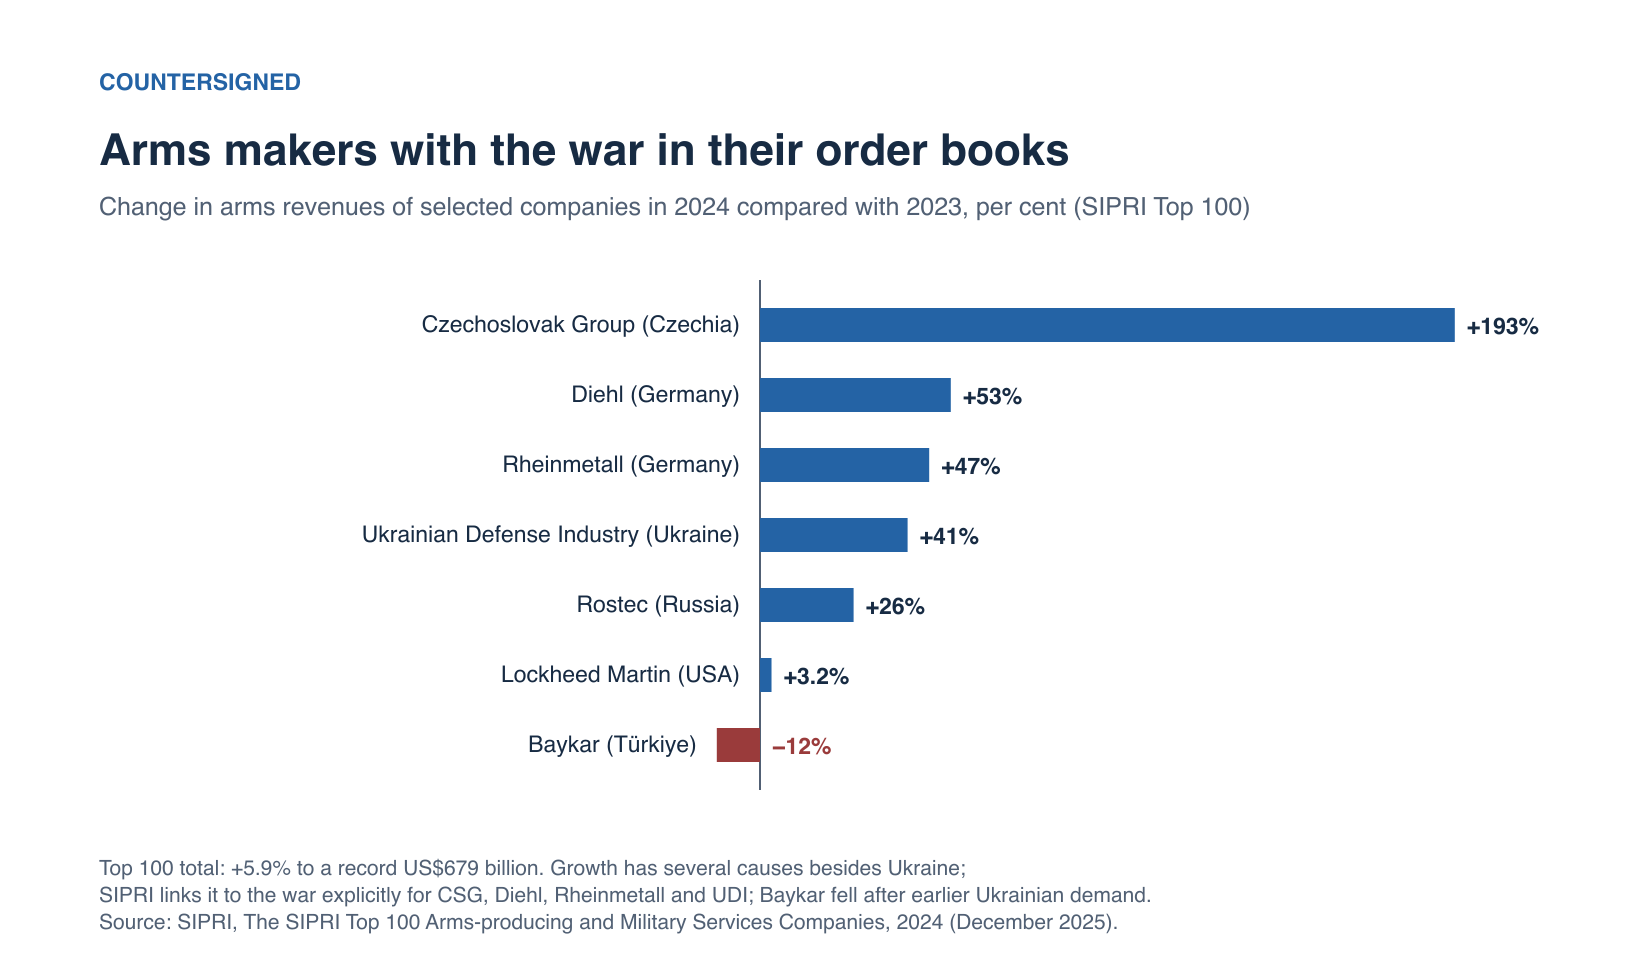
SIPRI ranks the world’s 100 largest arms-producing companies. Their combined arms revenues rose by 5.9 per cent in 2024 to USD 679 billion, “the highest level ever recorded by SIPRI” (S069). SIPRI explains the rise by demand “boosted by the wars in Ukraine and Gaza, global and regional geopolitical tensions, and ever-higher military expenditure” (S068). The 26 European companies in the ranking (excluding Russia) increased their arms revenues by 13 per cent to USD 151 billion, an increase SIPRI ties to “demand stemming from the war in Ukraine and the perceived threat from Russia” (S068). The 39 US companies grew by 3.8 per cent to USD 334 billion (S069).
Europe’s winners
The largest percentage gains were in Europe. The Czechoslovak Group (CSG) increased its arms revenues by 193 per cent to USD 3.6 billion in 2024, the largest increase of any company in the ranking; SIPRI attributes it partly to the Czech ammunition initiative (section 9) and notes that 51 per cent of its arms revenues were “linked in some way to Ukraine” (S069). Before the full-scale invasion CSG had revenue of about EUR 580 million; in 2025 it reported EUR 6.74 billion (S164). In January 2026 the family-owned company listed its shares in Amsterdam (S162; S163). According to Hunterbrook — a publication whose affiliated fund disclosed a short position in CSG’s shares, paired with a long position in comparable companies — the listing raised EUR 3.8 billion, of which the 33-year-old owner Michal Strnad received EUR 2.55 billion (S164). Hunterbrook argues that most of CSG’s ammunition revenue comes from reselling recommissioned shells rather than making them and concedes that its “calculations could also be wrong”; CSG “denied wrongdoing across all areas of inquiry” and calls accusations of profiteering “attacks based on half-truths” (S164).
Rheinmetall, Germany’s largest arms maker, raised its arms revenues by 47 per cent to USD 8.2 billion in 2024, “driven by growing demand for armoured vehicles and ammunition linked to the war in Ukraine”; its revenues from Ukraine itself more than doubled to USD 1.4 billion (S069). In the first half of 2026 its sales rose by 39 per cent to EUR 5.2 billion and its operating result by 74 per cent to EUR 786 million; its order backlog, including orders expected under existing framework contracts, reached EUR 80.5 billion (S156). The company names artillery and medium-calibre ammunition for Ukraine among the main sales drivers of its ammunition business, whose operating margin rose to 23.7 per cent (S156). Investors have rewarded it: by March 2025, Rheinmetall’s share price had risen more than twelvefold since the invasion, and its market value overtook that of Volkswagen (S322).
American companies: big orders, modest profits
For the large US companies the war is one source of demand among several. Lockheed Martin, the world’s largest arms maker, increased its arms revenues by 3.2 per cent in 2024 to USD 64.7 billion, partly because F-35 combat aircraft delayed since 2023 were delivered (S069). In July 2026 it raised its revenue forecast for 2026, and its order backlog rose by 38 per cent to USD 230.4 billion; its missiles unit grew on higher output of Patriot and THAAD air-defence interceptors (S158). RTX, the maker of Patriot missiles, won a USD 3.7 billion contract to supply Patriot interceptors to Ukraine in April 2026 (S159). According to Reuters, the stronger outlook is tied to “conflicts in Iran and Ukraine” (S158). Earlier in 2026, however, first-quarter results of the four largest US contractors “saw limited growth” because of supply-chain and production delays, and Lockheed’s quarterly profit fell (S161).
Russia: more weapons, less profit
Russian arms makers have grown fastest in volume. SIPRI estimates that the two Russian companies in its ranking increased their arms revenues by 23 per cent to USD 31.2 billion in 2024, as domestic demand more than offset falling exports (S069). Russia reportedly produced 1.3 million 152-millimetre artillery shells in 2024, compared with 250,000 in 2022 (S069). But the state conglomerate Rostec, whose enterprises according to Russian authorities make around 80 per cent of the weapons used by Russian forces, reported for 2025 a 25 per cent rise in revenue and a 42 per cent fall in net profit, to 76.4 billion roubles (S165; S166). Its head, Sergei Chemezov, said state defence contracts earn a margin of about 2 per cent (S166); the figure cannot be checked, because since a decree of March 2026 Rostec no longer publishes detailed accounts, and its subsidiaries reported losses (S165).
Ukraine: an industry larger than its budget
Ukraine’s own arms industry has grown from a small base. SIPRI’s only Ukrainian company, the state-owned JSC Ukrainian Defense Industry, increased its arms revenues by 41 per cent to USD 3.0 billion in 2024 (S069). President Zelensky said in October 2025 that more than 40 per cent of the weapons used at the front were produced in Ukraine or with Ukrainian participation (S167). According to Euromaidan Press, the industry’s production capacity has risen from about USD 1 billion at the start of the full-scale invasion to USD 35 billion a year, but domestic contracts covered only a third of it, and Kyiv has begun to allow controlled exports of surplus weapons (S168). Private firms now turn out more than 4 million drones a year (S168).
The rapid growth has brought suspicion. In August 2025 the Kyiv Independent reported, citing five anonymous sources, that the National Anti-Corruption Bureau (NABU) was investigating whether Fire Point, the maker of long-range drones and the Flamingo missile, had inflated prices or delivery numbers; the company confirmed an investigation but denied the accusations, and no charges had been brought (S169). Three sources said NABU was tracing the firm’s ultimate ownership to Tymur Mindich, a co-owner of Kvartal 95, the television studio founded by Zelensky; Mindich’s lawyers said they had no information on such a connection (S169). Fire Point sold drones worth about USD 320 million to the state in 2024, just under a third of the defence ministry’s drone budget (S169).
In this report’s assessment, defence companies on all sides have gained revenue from the war, European ammunition and vehicle makers most in percentage terms. The terms of some contracts, such as those of the Czech initiative and Fire Point, are disputed, and their oversight depends on investigations that are not yet complete.
11. Energy, shipping and food: winners and losers
Energy is where the war’s money is largest. It is also where Russia, its customers and some Western suppliers have all earned.
Russia’s export revenue: smaller, but over a trillion euros
According to CREA’s tracker, Russia’s revenue from exporting fossil fuels since the full-scale invasion passed EUR 1 trillion in early January 2026 (S176). CREA, which is funded by philanthropic grants and commissioned research, calls on all buyers to stop purchases (S177; S070). Revenue has been falling: in the fourth year of the invasion Russia earned EUR 193 billion, 19 per cent less than a year earlier and 27 per cent below pre-invasion levels (S177). Oil volumes, however, have hardly fallen; crude exports remained 6 per cent above pre-invasion levels, while revenue fell because Russia has to sell at deeper discounts (S176). In August 2026 Russia earned EUR 604 million a day (S341). Ukrainian drone strikes on refineries and ports have added to the pressure: revenue from oil products fell to the lowest level since the invasion, and in August 2026 Russia imported a record 172,000 tonnes of fuel (S341).
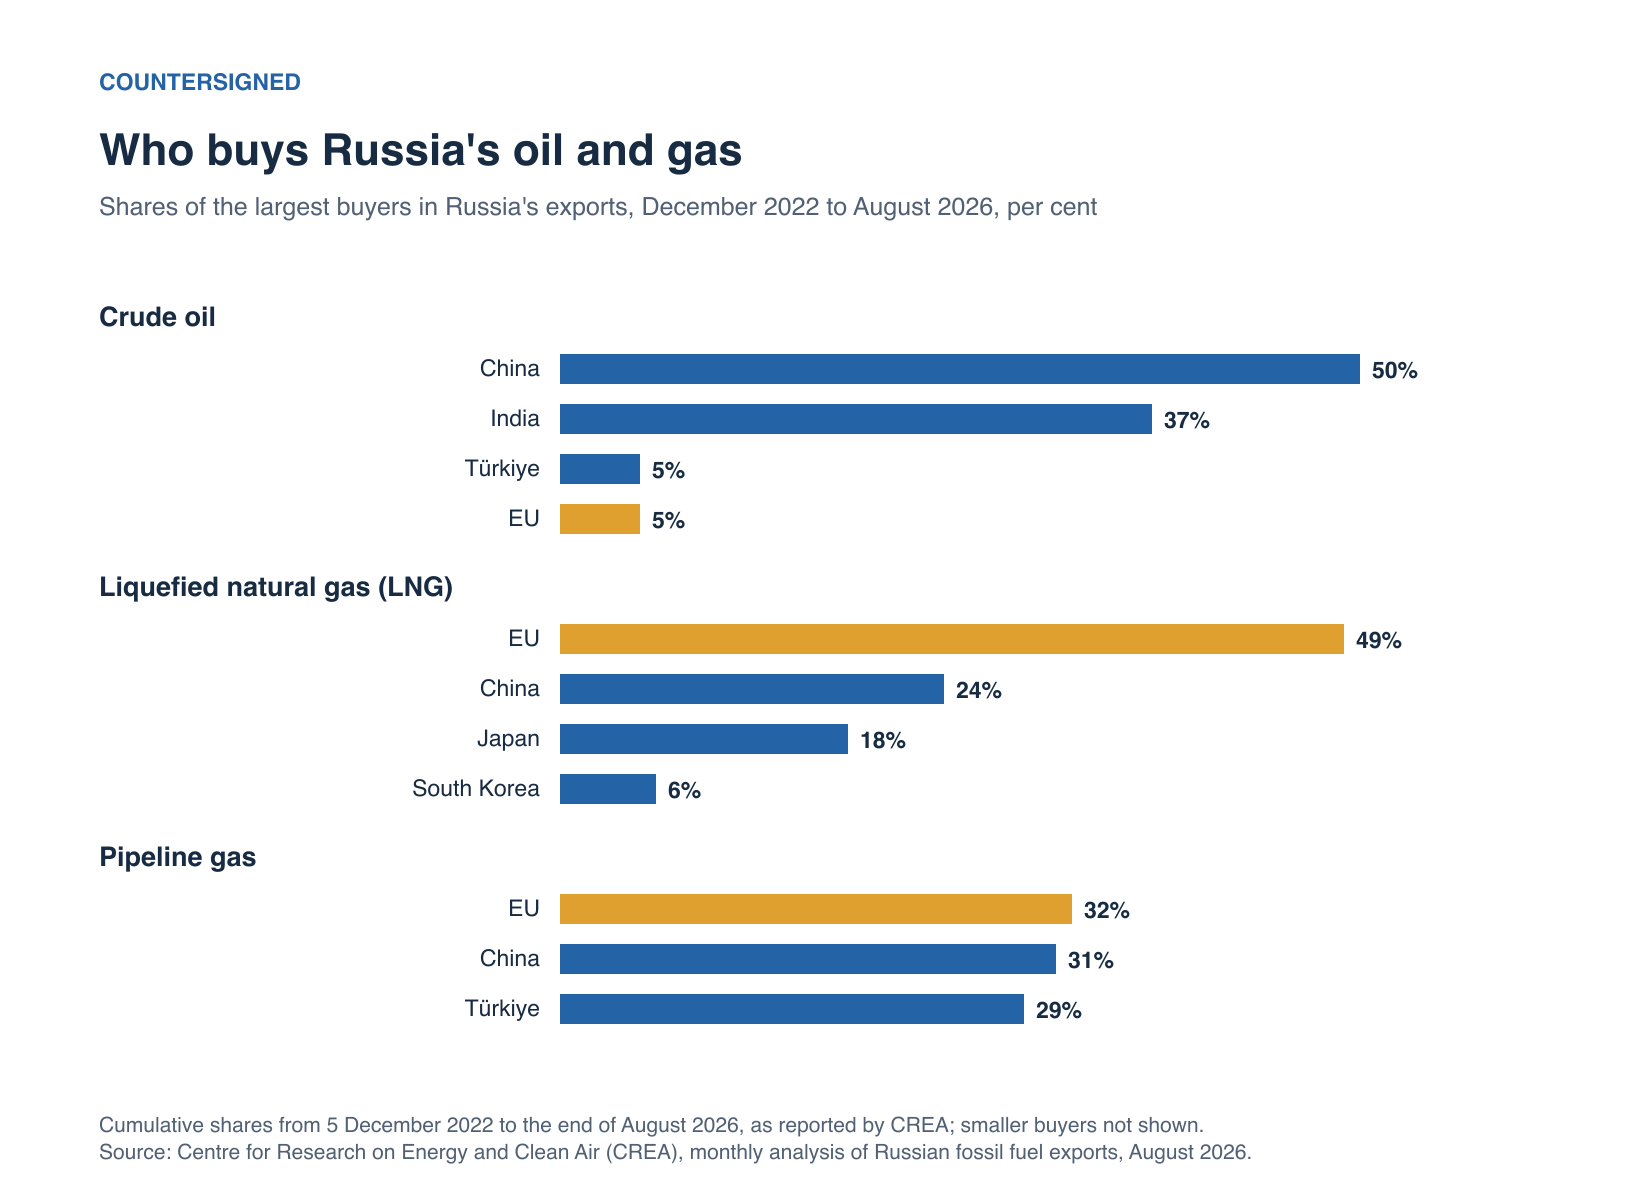
The buyers have changed, not disappeared. Since December 2022 China has bought 50 per cent of Russia’s crude exports and India 37 per cent; the EU, however, has remained the largest buyer of Russian liquefied natural gas (LNG), with 49 per cent, and of pipeline gas, with 32 per cent (S341). The EU still paid Russia EUR 1.2 billion for fossil fuels in August 2026, most of it for pipeline gas and LNG (S341); for Russian LNG alone it spent about EUR 7.2 billion in 2025, more than the EUR 6.3 billion of 2024, according to an analysis by the campaign group Urgewald (S316). Hungary and Slovakia, which have an exemption for Russian oil delivered by the Druzhba pipeline, increased their imports by 11 per cent in the first ten months of 2025; according to CREA, the profits of this exemption “flow to one company, MOL”, the Hungarian oil group that owns the only refineries in both countries (S177; S342). The price cap that Western countries set for Russian oil has not held: in August 2026 Urals crude sold for USD 69.9 a barrel, far above the cap of USD 44.1 (S341). The EU has decided to end its purchases: imports of Russian LNG are to be banned from the beginning of 2027 and of pipeline gas from autumn 2027 (S183).
Who gained from Europe’s switch
As Europe turned away from Russian gas, other suppliers gained. Russia’s share of EU gas imports fell from 45 per cent in 2021 to 19 per cent in 2024, according to the European Commission (S188). The United States supplied 58 per cent of the EU’s LNG imports in 2025, about a quarter of total EU gas demand, according to the EU energy regulators’ agency ACER (S315). The Institute for Energy Economics and Financial Analysis (IEEFA), cited by Euronews, estimates that EU countries spent roughly EUR 117 billion on US LNG between early 2022 and mid-2025 (S317).
Energy companies earned windfall profits when prices spiked in 2022. The EU imposed a “temporary solidarity contribution” of at least 33 per cent on the profits of fossil-fuel companies in 2022 and 2023 that exceeded the 2018–2021 average by more than 20 per cent (S188). It raised EUR 26.15 billion by mid-2024 (S188). Most member states used the money to support energy consumers, particularly vulnerable households (S188). Norway, a major gas exporter, was openly accused of profiting: in May 2022 Poland’s prime minister, Mateusz Morawiecki, said Norway “should share this excess, gigantic profit” and called it “indirect preying” on the war, while stressing that the war was not Norway’s fault (S189). Norway’s energy minister, Terje Aasland, had said in March 2022 that “there are times when it is not fun to make money, and this is one of them”, and the Norwegian daily Dagbladet wrote that “this is a form of war profit” (S189).
Who lost: transit, and Ukraine
The end of gas transit through Ukraine on 1 January 2025 created losers on all sides. Ukraine lost transit fees of about USD 800 million a year (S191); according to the Brussels think tank Bruegel, the fees had amounted to USD 1.2 billion in 2022 and USD 0.8 billion in 2023, about 0.5 per cent of Ukraine’s GDP (S192). Gazprom was expected to lose around USD 5 billion in revenue (S191). Austria, Hungary and Slovakia, for which the Ukrainian route had covered 65 per cent of gas demand in 2023, had to find other sources (S192).
Food and land: grain from occupied territories, and a false claim
Russia also profits from Ukrainian agriculture in the territories it occupies. Ukraine’s deputy economy minister estimated in 2025 that Russia had stolen 15 million tonnes of grain from these areas since 2022 (S197). According to Ukrainian intelligence, cited by the Kyiv Post, the wheat is mixed with Russian grain at Black Sea ports before export; these figures are Ukrainian government claims that the sources reviewed do not verify independently (S197).
A widespread claim holds that Western corporations have bought up Ukraine’s farmland. Its usual source is a 2023 report by the Oakland Institute, a US advocacy organisation, which estimates that more than 9 million hectares — over 28 per cent of Ukraine’s arable land — are controlled by “oligarchs, corrupt individuals, and large agribusinesses”, some of them with foreign investors (S196). The same report notes that foreigners are prohibited from buying Ukrainian farmland, although they may lease it (S196). The Australian fact-checker AAP FactCheck found a viral version of the claim — that President Zelensky sold 17 million hectares to US companies — baseless; Ukrainian law states that agricultural land “may not be transferred to the ownership of foreign nationals … foreign legal entities and foreign states” (S292). An author of the Oakland report told AAP that the story “sounds like fake news”, while maintaining that US and European firms and funds “do have significant interests” in Ukrainian agriculture (S292).
12. Banks, frozen assets and debt
Financial institutions earn from the war in three ways: from Russian money that cannot move, from lending and advising on both sides, and from the restructuring of debts that the war has made unpayable. Some of these earnings are skimmed off by governments; others are not.
Russia’s frozen reserves: who earns the interest
When Russia invaded in February 2022, Western states immobilised the foreign holdings of Russia’s central bank. The assets remain Russian property, but they may not be used. Most of them sit at Euroclear in Brussels, a securities depository — a company that holds and settles securities for banks and investors. As bonds matured, they turned into cash on Euroclear’s balance sheet, and that cash earns interest. At the end of June 2026 Euroclear Bank’s balance sheet totalled EUR 241 billion, “of which €202 billion relate to sanctioned Russian assets” (S294). The EU as a whole puts the cash accumulated at European financial institutions at around EUR 210 billion (S298).
The interest does not go to Russia. In 2025, Euroclear’s interest earnings from these assets were EUR 5 billion, 26 per cent less than in 2024 because interest rates fell; in the first half of 2026 they were EUR 2.3 billion (S295; S294). Under an EU regulation of May 2024, which covers profits from 15 February 2024, “a large portion of these profits is contributed to the EU” (S294; S295). By July 2026, Euroclear had “paid out approx. €6.6 billion through the windfall contribution” to the EU (S294); its earlier reports name the recipient as the European Fund for Ukraine (S295). Euroclear keeps the rest as a buffer against risks; for 2024 it retained 10 per cent of the contribution before paying about EUR 3.5 billion (S295; S201). Belgium also earns: Euroclear stated in 2025 that the interest, being subject to Belgian corporate tax, “generated €360 million in tax revenue for the Belgian State”, without stating the period (S201). Euroclear in turn bears costs, and in 2025 it set aside EUR 342 million against legal risks (S295).
Future windfall profits also service a larger loan: in October 2024 the G7 agreed on loans of about USD 50 billion to Ukraine, to be repaid from these proceeds (the ERA loans, section 8) (S026).
The reparations loan that was not made
In autumn 2025 the European Commission proposed going further: lending the frozen cash itself to Ukraine. Of the roughly EUR 210 billion, EUR 95 billion was to cover Ukraine’s budget needs, including EUR 45 billion for the ERA loans, and EUR 115 billion was to strengthen its defence industry (S298). Ukraine would have repaid the loan only if Russia paid reparations (S024). Belgium, where most of the assets are held, refused to agree without legally binding guarantees that the other member states would share the risk, including the risk of having to repay Euroclear at short notice (S025; S024).
On 12 December 2025 the EU decided to keep the Russian central-bank assets frozen indefinitely, by qualified majority, so that no single member state could block it, rather than renewing the freeze every six months (S297; S024). At its summit later that month, however, the European Council chose EUR 90 billion of joint EU borrowing instead of the reparations loan, deciding “not to move forward with a Reparations Loan backed by the Russian immobilised assets at this stage”, as Euroclear summarised the decision (S295). Its interest is paid from the EU budget; the frozen assets remain available as a fallback for repayment (section 8).
Russia has responded through its own courts. On 15 May 2026 a Moscow court ordered Euroclear to pay the Central Bank of Russia 18.17 trillion roubles, about EUR 200 billion, in damages; an appeal court upheld the order on 16 July 2026 (S299; S300; S294). Euroclear does not recognise the court’s jurisdiction (S299).
Western banks and companies in Russia
Not all Western money left Russia. Raiffeisen Bank International (RBI) of Austria is described by the campaign coalition B4Ukraine as the largest international bank still operating there (S207). By the end of 2025 the loan book of Raiffeisenbank Russia was 60 per cent smaller than at the start of the war (S204), but it remained profitable: according to Reuters, its pre-tax profit in Russia rose by more than 25 per cent in the first quarter of 2025 to EUR 575 million (S206). It has also lost money there: a Russian court awarded about EUR 2 billion to Rasperia, a company linked by bne IntelliNews to the sanctioned businessman Oleg Deripaska, and the sum was deducted from Raiffeisenbank’s account at the Russian central bank (S206; S205).
For companies that left, the exit was expensive, and Russian buyers bought cheaply. A Reuters analysis of company filings put the cost to foreign companies of leaving Russia at more than USD 107 billion in write-downs and lost revenue by March 2024. Moscow, Reuters wrote, “demands discounts of at least 50 per cent on foreign asset sales” and sometimes accepts nominal fees as low as one rouble (S301). The Kyiv School of Economics (KSE) estimated direct losses at more than USD 170 billion by February 2025 under a wider definition that includes seizures and exit taxes (S222). In some cases the Russian state took control directly: in 2023 it placed Fortum’s Russian business under temporary state management and did the same with the foreign shares in Danone’s and Carlsberg’s Russian subsidiaries (S208; S209); Danone’s business was later sold to a company called Vamin R (S209). At the end of 2025, decrees transferred the Russian assets of the Danish insulation maker Rockwool and the Polish-American packaging company Canpack to Russian companies (S222).
Many companies stayed, and they pay taxes in Russia. KSE’s database counts 55 per cent of the roughly 4,264 foreign companies it tracks as still operating in Russia in January 2026, and its estimate with B4Ukraine is that international companies paid “at least $20 billion in taxes there in 2024 alone” (S222). KSE is part of a Ukrainian campaign for Western companies to leave Russia; its figures are estimates.
Russian and Ukrainian banks
Inside Russia, the largest bank keeps earning. Sberbank reported a net profit under international accounting standards of 1.307 trillion roubles for the first nine months of 2025, 6.5 per cent more than a year earlier (S306). Sanctions on Russian banks have pushed payments to new channels. A7A5, a stablecoin (a cryptocurrency pegged to a currency) tied to the rouble and launched in Kyrgyzstan in January 2025, moved more than USD 1 billion a day in mid-2025 according to the analytics firm Elliptic (S219); the United Kingdom sanctioned a Kyrgyz bank and exchanges linked to it in August 2025 (S220).
Ukrainian banks have also earned well during the war, largely from lending and from investing in government bonds (S278). In the first nine months of 2023, solvent banks earned what Interfax-Ukraine called a record UAH 109.9 billion (hryvnia), compared with UAH 7.4 billion a year earlier (S217). The state took a large share: parliament raised the profit tax on banks from 18 to 50 per cent for 2023 (S217) and kept that rate for 2024, when the banks earned UAH 103.7 billion and paid UAH 83.7 billion in taxes (S278). The largest earner is PrivatBank, which the state owns (S278).
Ukraine’s creditors
The war made Ukraine’s old debts unpayable, and its private creditors took losses. In the 2024 restructuring of about USD 23 billion of Eurobonds (bonds sold on international markets), bondholders accepted a write-off of 37 per cent of the face value, with a possible partial recovery if the economy grows above an agreed level by 2028 (S212). The creditors’ committee “included Amundi SA, BlackRock Inc, Amia Capital LLP, and other investors”; the government expected the deal to save it USD 11.4 billion over three years (S212).
One debt dates from before 2014: the USD 3 billion Eurobond that Russia bought in December 2013 (section 2). A trustee acting for Russia sued in London; Ukraine argues that the bond was issued under duress. In March 2023 the UK Supreme Court sent the case to a full trial; the held sources record no final outcome (S215).
BlackRock and JPMorgan, two names often cited in claims about who profits from Ukraine, appear in the documents as advisers, not owners. BlackRock’s advisory unit agreed in November 2022 to help design “an investment framework” for reconstruction (S302), and JPMorgan agreed in February 2023 to advise on financial stabilisation, credit ratings and attracting private investment (S304; S305). The resulting Ukraine Development Fund aimed to raise USD 2 billion from private investors; BlackRock halted the search in January 2025 (section 15) (S223).
In this report’s assessment, the documented beneficiaries of the frozen Russian money are the European Fund for Ukraine and the Belgian state, which taxes the interest. Western banks that stayed in Russia earn and pay taxes there; Western investors in Ukraine’s bonds accepted losses.
13. Reconstruction: needs, money and the companies involved
Rebuilding Ukraine will be one of the largest investment programmes in Europe — and the money has to be found before it can be spent. The evidence shows a large gap between needs and committed funds, a role for global companies that is so far modest, and governance risks that the authorities themselves have exposed.
What it will cost
The fifth Rapid Damage and Needs Assessment (RDNA5), prepared jointly by the World Bank, the Government of Ukraine, the European Commission and the United Nations, estimates recovery and reconstruction needs at USD 587.7 billion over the ten years 2026–2035, almost three times Ukraine’s GDP in 2025 (S242). It separates three measures: USD 195.1 billion of direct damage to buildings and infrastructure from February 2022 to December 2025, USD 666.7 billion of economic and social losses, and the reconstruction needs themselves, which “do not equal the sum of damage and losses” (S242). Housing has suffered the most damage, USD 61.1 billion; about 14 per cent of the housing stock is damaged or destroyed (S242). Needs are highest in transport (USD 96.3 billion), energy and mining (USD 90.6 billion) and housing (USD 89.8 billion) (S242). The estimate has risen with every assessment, from USD 349 billion in the first in 2022 to USD 524 billion in the fourth in 2025 (S242).
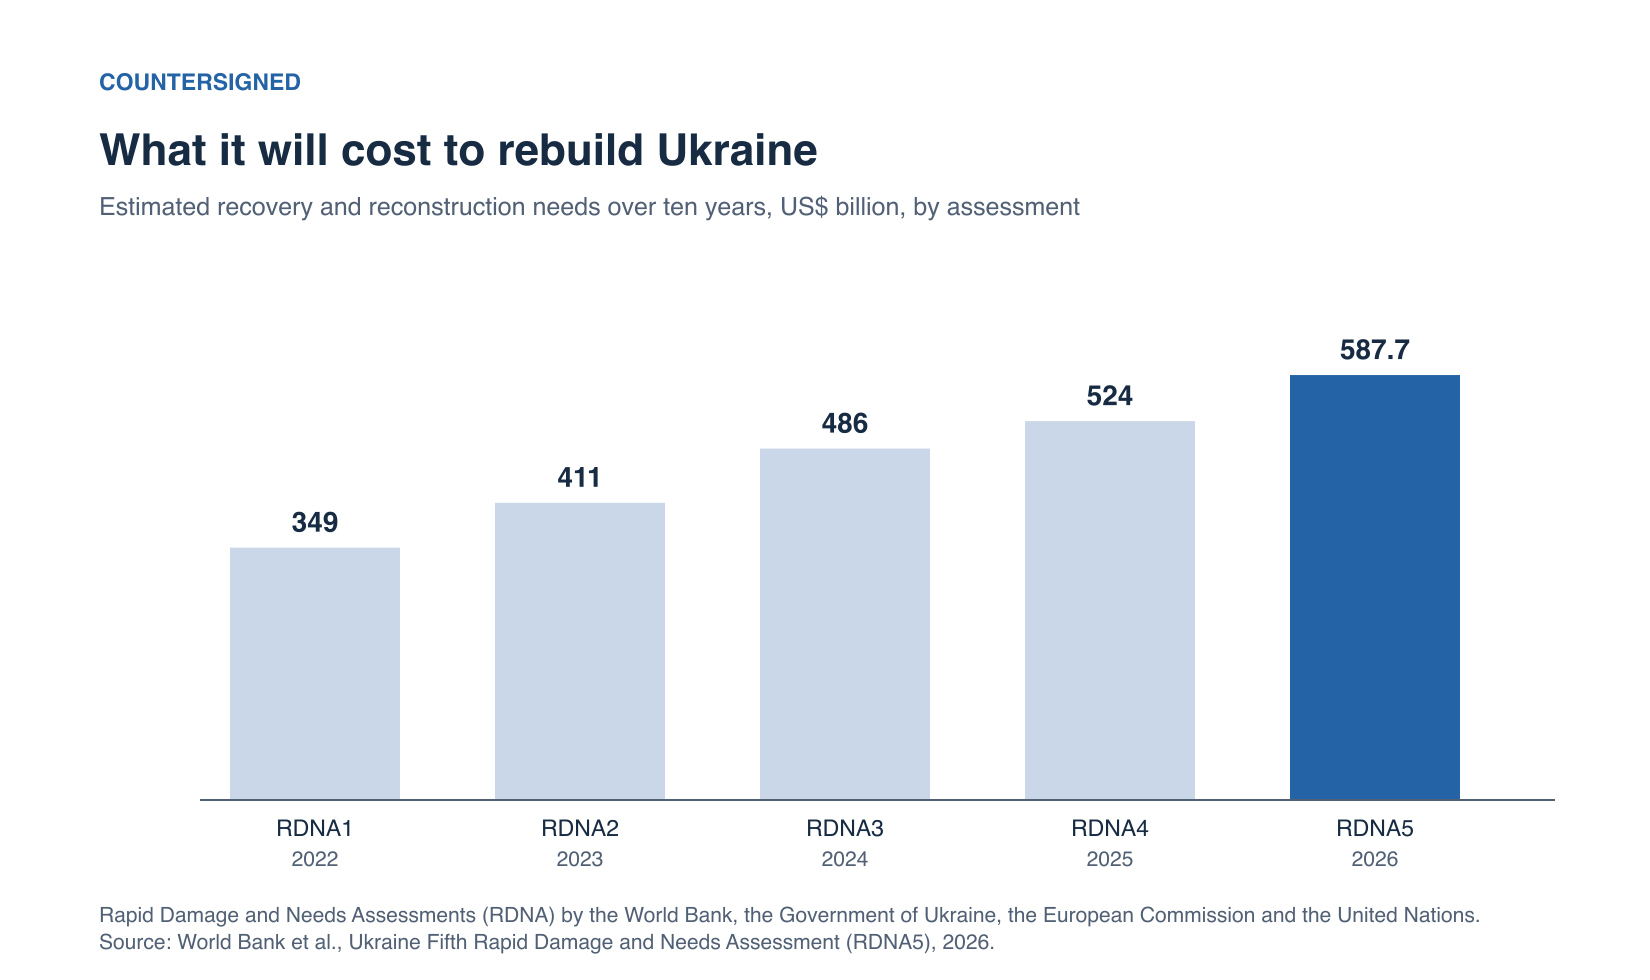
The money in hand is a fraction of this. For its 2026 priority projects the government identified needs of USD 15.25 billion; the state budget and confirmed partner funding covered about USD 5.77 billion, leaving a gap of about USD 9.48 billion, largest in energy (S242). At least USD 20.3 billion of needs had been met by urgent repairs since 2022 (S242). RDNA5 concludes that the scale of reconstruction “far exceeds the likely level of public resources”, and that up to 40 per cent of the needs could be covered by private companies over a decade if reforms are made (S242).
Who is putting up the money
Pledges at international conferences are large, but they are not the same as money spent. At the Ukraine Recovery Conference in London in 2023, combined pledges of USD 60 billion were reported (S258); the 2026 conference was held in Gdańsk on 25 and 26 June, organised by Poland and Ukraine; ahead of it, Poland’s prime minister spoke of 200 contracts “worth billions of euros” (S245). The held sources contain no comprehensive account of how much of these pledges has been disbursed.
Public development banks carry most of the risk so far. The European Bank for Reconstruction and Development (EBRD) describes itself as Ukraine’s largest institutional investor (S247). The EU’s Ukraine Investment Framework, part of the Ukraine Facility, provides guarantees and grants to draw private capital in (S019); a typical example is a programme launched in June 2026 in which EUR 41 million of EU guarantees cover the first losses of loans by the EBRD and Ukrainian banks to small and medium-sized companies (S247).
The US–Ukraine minerals fund. On 30 April 2025 the United States and Ukraine signed an agreement on a joint Reconstruction Investment Fund (S015). According to the Center for Strategic and International Studies, it is managed by both countries “on an equal partnership basis”; Ukraine contributes 50 per cent of the revenue from new mineral, oil and gas projects, keeps full ownership of its resources, and future US military aid counts as the US contribution; Ukraine does not have to repay past aid (S016). Each side paid USD 75 million into the fund; its first portfolio comprises eight projects worth USD 1.2 billion (S250). Its flagship is the Dobra lithium deposit in central Ukraine, awarded in a tender to a joint venture of RSL Group, owned by the American businessman Ronald Lauder, and TechMet, which is backed in part by the US government’s development finance agency (S198). Two of Ukraine’s four lithium deposits lie in Russian-occupied territory (S016).
Global companies. Investments by multinational companies are real but modest compared with the needs. Nestlé, for example, plans to invest UAH 10 billion in Ukraine by the end of 2026 — most of it in marketing and product development rather than factories — and is raising its total investment in a noodle factory in the Volyn region to EUR 70 million by the end of 2027 (S251). The fastest-growing foreign presence is in the arms industry: Rheinmetall founded a joint venture with the state-owned Ukrainian Defense Industry in Kyiv in October 2023 and agreed in 2024 to build an ammunition plant through a new company in which it holds 51 per cent (S252); the Turkish drone maker Baykar said its plant near Kyiv would be ready in August 2025, although Ukraine’s ambassador in Ankara expected full operation only after the war (S253). The advisory roles of BlackRock and JPMorgan are described in section 12.
Ukrainian business: losses in the east
Ukraine’s largest business groups have lost assets to the war. The industrialist Rinat Akhmetov saw his net worth fall by 52 per cent by October 2022, according to the Bloomberg Billionaires Index; around 70 enterprises of his SCM Group were destroyed, damaged or occupied, including the Azovstal steelworks in Mariupol (S240). SCM puts the reparations for Azovstal and the Ilyich steelworks alone at USD 17 to 20 billion, and Akhmetov has sued Russia at the European Court of Human Rights (S240).
Russia, for its part, has taken over Ukrainian assets in the territories it occupies. In October 2022 President Putin decreed that the occupied Zaporizhzhia nuclear power plant be taken into Russian federal ownership; the Russian state nuclear corporation Rosatom created a company to run it (S238). A Russian construction ministry official said in 2023 that rebuilding Azovstal would be “impossible and unprofitable” (S239).
Corruption risks
Reconstruction money attracts corruption, and Ukrainian investigators have uncovered several cases. In late 2023 the National Anti-Corruption Bureau (NABU) exposed three bribery attempts related to reconstruction, including a member of parliament who allegedly offered the head of the reconstruction agency a bribe of USD 50,000 in Bitcoin (S259). NABU said in November 2025 that it was investigating more than ten criminal cases of abuse in building fortifications (S257). The largest case, “Operation Midas”, concerns the state nuclear operator Energoatom: according to the anti-corruption authorities, a group extracted 10 to 15 per cent of contract values from suppliers, embezzling at least USD 100 million; seven people were charged (S059). The two ministers concerned resigned (S061), and the head of the president’s office, Andriy Yermak, resigned after NABU searched his home, without having been charged (S060). These are allegations and charges, not convictions.
Ukraine has built controls in response. Restoration projects must be registered in the DREAM system (Digital Restoration Ecosystem for Accountable Management), an online register that publishes their data (S258; S259); by early 2024 more than 2,100 projects with confirmed funding of UAH 131 billion were in it (S259). A report by the Basel Institute on Governance and Transparency International Ukraine nevertheless found that only 35 per cent of completed tenders had more than one bidder, and that 75 per cent of Ukrainians named corruption among their top concerns about reconstruction (S259).
14. Who bears the cost
Following the money also means asking who ends up paying. The answers differ by country and cannot simply be added up, because the same euro may appear as a loan, as aid and as arms-industry revenue. The evidence in the previous sections points to five groups.
Ukrainians bear by far the largest cost. The World Bank-led assessment puts direct damage at USD 195.1 billion and economic and social losses at USD 666.7 billion by the end of 2025 (S242). The state spends about 40 per cent of the country’s economic output on defence (S117), and its debt more than doubled from USD 98.0 billion in 2021 to USD 213.3 billion at the end of 2025, as large as the whole economy; interest alone took 11 per cent of budget revenue in 2025 (S276). Ukrainians also pay through taxes, including a military levy that the EU required to be extended as a condition of its loan (S282). The loss of life and health, the largest cost of all, is not measured in money in this report.
Russians pay through their budget, prices and their soldiers. Social policy, education and health together account for a third less of the federal budget than before the invasion (S075). Value-added tax rose to 22 per cent in 2026, with the proceeds earmarked for “military spending and security forces” (S230), and the central bank’s key rate peaked at 21 per cent (S307). The Russian state has also lost the use of about EUR 210 billion of central-bank reserves frozen in Europe (S298). Payments to soldiers and to the families of the killed and wounded transfer money to some households, at the price of their members’ lives and health (section 6).
Taxpayers in donor countries pay, but much of the money stays at home. The US Congress made USD 196.43 billion available, mostly as grants (S137; S010), but about 60 per cent of US aid is spent in the United States (S056). The EU and its member states count EUR 224.5 billion of support since 2022 (S022); about 82 per cent of EU assistance consists of loans (S010). Under the EUR 90 billion loan for 2026–27, Ukraine repays only if Russia pays reparations; failing that, the EU may use frozen Russian assets (S098; S097). Meanwhile the EU budget pays the interest, estimated at about EUR 3 billion a year from 2028 (S010).
Citizens of NATO countries will pay for rearmament for years. Military spending in Central and Western Europe rose by 87 per cent in real terms between 2014 and 2025, to USD 547 billion in 2025 alone, at 2024 prices (S340) — more than twice the EUR 224.5 billion that the EU and its member states have provided to Ukraine in total since 2022 (S022). NATO’s new targets for 2035 — at least 3.5 per cent of GDP for core defence plus up to 1.5 per cent for related investment (S326) — compare with the 2.27 per cent that the European members and Canada spent in 2025 (S328).
Private creditors and companies have absorbed losses. Holders of Ukraine’s bonds gave up USD 8.67 billion in claims in the 2024 restructuring (S212), and foreign companies that left Russia lost more than USD 107 billion by March 2024, according to Reuters (S301).
In this report’s assessment, the bill falls mainly on Ukrainian society, followed by Russian households and the taxpayers of Europe. The largest Western sums now go to rearmament rather than to aid for Ukraine, and European taxpayers carry the interest and the risk of an EU loan that is to be repaid from Russian reparations or frozen Russian assets — both of which depend on how the war ends.
15. Contested money claims — what the evidence shows
This section tests the most widely repeated claims about the war’s money against the evidence reviewed, by the same standard for all sides. Each claim is given in a typical wording, not as a quotation. “Unsupported” means that the sources reviewed contain no evidence for a claim, not that every element of it has been disproved.
- “The United States gave Ukraine USD 350 billion.” — Wrong as stated. President Trump repeated the figure in 2025, saying in August that “it could be $350 billion worth of equipment and money and everything else” (S260); the White House did not explain where it came from (S261). According to the inspectors general, cited by CNN, the United States appropriated about USD 185 billion for its response to the war through March 2025, of which about USD 90 billion had been paid out (S260); the inspectors general’s later total of USD 196.43 billion by June 2026 likewise includes spending that is not aid to Ukraine (section 9). The Kiel Institute counted about USD 134 billion of US aid allocated to Ukraine from January 2022 to June 2025 (S260).
- “USD 100 billion of US aid has gone missing.” — Wrong. The claim drew on President Zelensky’s remark in February 2025 that Ukraine had received only USD 75 billion of the USD 175 billion the United States had spent, and that “I don’t know where all the money is” (S056). CSIS answered: “The short answer is that it is not missing.” Only part of the aid passes through Ukrainian control; much of it pays for war-related activities in the United States and elsewhere (S056).
- “Western weapons are being sold on the black market.” — Unsupported as a claim of large-scale diversion; the risk is real. In October 2023 Russia’s first deputy permanent representative to the UN estimated that 20 per cent of the arms and ammunition sent to Ukraine were being diverted (S263). The Pentagon’s inspector general told Congress in March 2023 that his office had “not substantiated any instances of the diversion of U.S. security assistance to Ukraine” (S090). A January 2024 evaluation found the tracking of weapons worth USD 1.005 billion overdue, but did not examine whether diversion had occurred (S049). A December 2025 study by the Small Arms Survey, a Geneva research centre, and the Kyiv-based Center for Security Studies (CENSS), funded by the German foreign office, concluded that Western weapons “have proliferated throughout Ukraine, but there is no evidence of large-scale, systematic diversion”; European police had seized weapons trafficked from Ukraine “infrequently and only in small quantities” (S263). Europol has warned that the spread of weapons in Ukraine could increase trafficking into the EU (S323), and US analysts expect the problem could emerge “if and when combat ceases” (S096).
- “BlackRock owns Ukraine.” — Unsupported. BlackRock’s advisory unit agreed in November 2022 to advise Ukraine’s economy ministry on an investment framework for reconstruction (S302). It suspended talks with investors about a recovery fund in January 2025, describing its advisory work as free and saying it had no “active mandates” with the government (S223). BlackRock was also on the creditor committee whose bondholders accepted a 37 per cent nominal loss in Ukraine’s 2024 debt restructuring (S212). None of this amounts to owning Ukrainian assets or land.
- “Zelensky sold 17 million hectares of farmland to Monsanto, DuPont and Cargill.” — False. AAP FactCheck rated the claim false because Ukrainian law states that agricultural land “may not be transferred to the ownership of foreign nationals, stateless persons, foreign legal entities and foreign states” (S292). The Oakland Institute article cited as its source does not make the claim (S292). The institute’s own estimate — that oligarchs, corrupt individuals and large agribusinesses control over 9 million hectares, more than 28 per cent of arable land — is a different and more limited claim (section 11) (S196).
- “Zelensky has bought mansions and a USD 1.2 billion property empire.” — False. A story about a USD 20 million mansion in Florida used photographs of a different house more than 200 miles away; public records showed no property owned by Zelensky in the county concerned (S265). In 2025 Euronews found no evidence for a story about a USD 1.2 billion “real estate empire”, spread by a website imitating the names of real British newspapers (S267). Separately, investigators allege corruption in the president’s wider circle: in the “Midas” case they say roughly USD 100 million passed through a scheme at the state nuclear company that may implicate Tymur Mindich, a close associate of the president (S061); these are allegations, not court findings (section 13).
- “Ukraine is the most corrupt country in the world.” — An exaggeration of a real problem. Slovakia’s prime minister, Robert Fico, said so in October 2023 (S089). At the time Ukraine ranked 116th of 180 countries in Transparency International’s Corruption Perceptions Index (S087) — poor, but far from last. Large corruption cases are documented and prosecuted (sections 10 and 13).
- “Hunter Biden’s Burisma pay shows that US policy served corrupt interests.” — Payments documented; influence on policy not shown. Hunter Biden held a directorship at the Ukrainian energy company Burisma from 2014, while his father was US vice-president (S271). A 2020 US Senate committee report described more than USD 4 million paid by Burisma to him and a business partner for board membership (S270), and quoted a US diplomat who called his presence on the board “very awkward” for officials pushing an anti-corruption agenda (S270). The same report said that the extent to which this “affected U.S. policy toward Ukraine is not clear”; according to the New York Times’ summary, cited by PolitiFact, it did not present evidence of improper influence or wrongdoing by Joe Biden (S271).
- “The arms industry started or prolongs the war for profit.” — Unsupported. Arms makers have gained revenue (section 10), and some US analysts have presented aid as an investment in American industry (S057). But the evidence reviewed contains no indication that company decisions caused the war, and the level of aid has been set by governments, as shown when US aid fell by 99 per cent in 2025 (S115).
- “Russia’s economy is booming thanks to the war” / “Russia’s economy is collapsing.” — Both overstated. After growth of 4.1 per cent in 2023 and 4.3 per cent in 2024, the economy grew by 1.0 per cent in 2025 (S230; S229). The budget deficit for 2025 was expected to be nearly five times the planned level, value-added tax was raised to 22 per cent, and inflation stood at 6.3 per cent in early September 2026 (section 6) (S230; S074). The war is redistributing income towards soldiers and arms makers while the general public pays through taxes and prices.
Method and evidence limits
Question and scope. The report follows the money in the conflict between Russia and Ukraine from the gas disputes before 2014 to the evidence cutoff of 5 October 2026: who finances each side, what the two states spend on their armed forces, where aid and war budgets end up, who bears the costs and who earns from the war, including banks, defence companies, energy traders and investors in reconstruction. At the publisher’s request it also places Russia’s and Ukraine’s spending in the context of global rearmament since 2014. The history of the war, its causes and the diplomacy are covered in Countersigned’s report “Russia and Ukraine: history, war, diplomacy and prospects” of 28 September 2026 and are not repeated here.
Sources. The report rests on 295 sources that were downloaded and stored before writing, 195 of which are cited: budget laws and official statistics, reports of audit and oversight bodies, central-bank and company publications, court decisions, data from research institutes such as the Stockholm International Peace Research Institute (SIPRI) and the Kiel Institute for the World Economy, and investigative journalism. Sources that refused automated access were recorded as not held and are not cited as if they had been read. Every figure and every quotation in the text was checked by a script for its presence in the stored copy of its source, and the exact passage is recorded in the case’s claims register; a script check shows that a passage exists, not that it was read correctly, so interpretation and arithmetic were checked in a separate step by the AI system that drafted the text and, for a sample of 20 sentences, by separate AI agents.
How figures are compared. Amounts are given in the currency and price basis of the source. Comparisons over time use constant prices where the source provides them (SIPRI: constant 2024 US dollars; NATO: constant 2021 prices), so that inflation does not inflate the growth. Aid figures distinguish between what was promised (committed), what was earmarked for specific deliveries (allocated, in the Kiel Institute’s terminology) and what was actually paid out (disbursed). Grants and loans are kept apart, because loans are repaid by the recipient. Changes calculated by Countersigned are marked as such.
What the evidence cannot show. Russia has classified large parts of its defence budget, so SIPRI’s figures for Russia are estimates. No complete public ledger shows which company received how much of the aid to Ukraine; the report traces the money through the mechanisms that are documented. Company results show revenue and profit, but not which part is due to the war in Ukraine as opposed to other conflicts and rearmament; where companies or analysts attribute growth to the war, this is quoted as their assessment. Leaked documents and the estimates of individual analysts are attributed and marked as such. Allegations of corruption are reported with their procedural status — suspicion, charge, conviction — and a suspicion is not a finding of guilt.
Profit is not wrongdoing. The report separates four things that are often mixed up: lawful revenue from selling goods and services; profits that critics consider excessive; corruption, meaning the abuse of entrusted power for private gain; and sanctions evasion. Earning money from a war does not by itself show that anyone caused or prolonged it; where such influence is claimed, the report asks what evidence supports it.
Review. The text was drafted with AI assistance (Claude) and checked against the stored sources by scripts. The publisher, Łukasz Ostrowski, is responsible for the publication; he approved this edition on 8 October 2026. External specialist review is not part of Countersigned’s model; no independent human fact-check has taken place. Corrections: countersigned.org/en/corrections.
Glossary
- Allocated aid (Kiel Institute): aid that a donor has earmarked for delivery in specific packages, as distinct from general promises (commitments).
- Appropriation (US): money that Congress makes legally available; it is then obligated (contracted) and disbursed (paid out) over several years.
- Constant prices: amounts adjusted for inflation to the price level of one base year, so that different years can be compared.
- Eurobond: a bond issued by a state or company in a currency other than its own, typically US dollars or euros, on international markets.
- Frozen (immobilised) assets: foreign holdings of Russia’s central bank that may not be used or moved because of sanctions; they remain the property of the Russian state.
- Haircut: the share of a debt that creditors write off in a restructuring.
- Off-budget financing: spending that does not appear in the state budget, for example loans that banks are required to grant on state-set terms.
- Price cap: a ceiling on the price of Russian oil, introduced by the G7 countries and Australia in December 2022 to reduce Russia’s revenue; the EU and the United Kingdom set it at USD 44.1 per barrel from February 2026.
- Shadow fleet: ageing tankers with opaque ownership and no reliable Western insurance that Russia uses to sell oil outside the price cap.
- Windfall profits (Euroclear): the extraordinary interest income that the Belgian depository earns on frozen Russian cash; a large portion is paid to the EU for Ukraine.
Sources and exact reference points
- S001 · www.oxfordenergy.org — The Russian-Ukrainian gas crisis of January 2006 — Jonathan Stern, Oxford Institute for Energy Studies (2006-01)
- S002 · www.oxfordenergy.org — The Russo-Ukrainian gas dispute of January 2009: a comprehensive assessment — Jonathan Stern, Simon Pirani, Katja Yafimava, Oxford Institute for Energy Studies (2009)
- S004 · www.kielinstitut.de — Ukraine Support Tracker (topic dossier and interactive tracker) — Kiel Institute for the World Economy (IfW Kiel) (2026-08-13)
- S008 · www.kielinstitut.de — Ukraine Support: Europe largely fills the US aid withdrawal, led by the Nordics and the UK — Kiel Institute for the World Economy (2025)
- S009 · www.kielinstitut.de — Ukraine Support Tracker – Methodological Update & New Data (Research Note) — Kiel Institute for the World Economy (2024-06-05)
- S010 · www.europarl.europa.eu — State of play: EU support to Ukraine (EPRS briefing) — European Parliamentary Research Service (European Parliament) (2026-05)
- S011 · www.state.gov — U.S. Security Cooperation with Ukraine (fact sheet) — U.S. Department of State (2025-03-12)
- S013 · www.gao.gov — Presidential Drawdown Authority: Guidance Should Reflect Expanded Use (GAO-25-107475) — U.S. Government Accountability Office (2025)
- S014 · www.congress.gov — U.S. Security Assistance to Ukraine Since 2022 (CRS In Focus IF12040) — Congressional Research Service (2024-05-22)
- S015 · home.treasury.gov — Treasury Announces Agreement to Establish United States-Ukraine Reconstruction Investment Fund — U.S. Department of the Treasury (2025-04-30)
- S016 · www.csis.org — What to Know About the Signed U.S.-Ukraine Minerals Deal — Center for Strategic and International Studies (2025)
- S018 · www.globalsecurity.org — A year of PURL: nearly $7 billion for deliveries of critical weapons to Ukraine — Ukraine Ministry of Defense (mirrored by GlobalSecurity.org) (2026-07-23)
- S019 · commission.europa.eu — The Ukraine Facility (European Commission) — European Commission (ongoing (updated 2026))
- S020 · www.consilium.europa.eu — The Ukraine Facility (Council of the EU) — Council of the European Union (continuously updated)
- S021 · www.consilium.europa.eu — EU military support for Ukraine (European Peace Facility) — Council of the European Union (2026-08-12)
- S022 · defence-industry-space.ec.europa.eu — Commission disburses €3.3 billion in defence funding to Ukraine — European Commission (Defence Industry and Space) (2026-09-18)
- S024 · www.cer.eu — The Ukraine Reparations Loan: How to fix Europe’s financial plumbing — Centre for European Reform (2025)
- S025 · carnegieendowment.org — Time for Europe to Break the Bank on Ukraine — Carnegie Endowment for International Peace (2025-11)
- S026 · www.g7italy.it — G7 Leaders’ Statement on Extraordinary Revenue Acceleration (ERA) Loans — G7 (Italian G7 Presidency) (2024-06)
- S027 · researchbriefings.files.parliament.uk — Financial Assistance to Ukraine Bill 2024-25 (research briefing CBP-10133) — UK Parliament, House of Commons Library (2024)
- S028 · msmt.info — Unlawful Military Cooperation including Arms Transfers between North Korea and Russia (MSMT/2025/1) — Multilateral Sanctions Monitoring Team (2025-05-29)
- S033 · www.fdd.org — U.S. Sanctions Iranian Entities for Helping Russia Build Drones — Foundation for Defense of Democracies (FDD) (2024-02-24)
- S035 · www.uscc.gov — China’s Facilitation of Sanctions and Export Control Evasion — U.S.-China Economic and Security Review Commission (2025-11)
- S038 · carnegieendowment.org — Behind the Scenes: China’s Increasing Role in Russia’s Defense Industry — Carnegie Endowment for International Peace (2024-05)
- S040 · kse.ua — Russia Pays China a Growing Premium for War-Critical Technology - Russian CHP Imports Tracker for Q2 2026 — KSE Institute (Kyiv School of Economics) (2026-07-03)
- S043 · carnegieendowment.org — The Impact of U.S. Sanctions and Tariffs on India’s Russian Oil Imports — Carnegie Endowment for International Peace (2025-11)
- S044 · www.npr.org — U.S. imports fuel from India that’s made from Russian oil — NPR (2025-09-08)
- S045 · commission.europa.eu — Future of European defence (White Paper for European Defence – Readiness 2030) — European Commission (2025-03-19)
- S049 · www.dodig.mil — Evaluation of the DoD’s Enhanced End-Use Monitoring of Defense Articles Provided to Ukraine (DODIG-2024-043) — DoD Office of Inspector General (2024-01-10)
- S053 · www.gao.gov — Ukraine: State Should Build on USAID’s Oversight of Direct Budget Support (GAO-25-107057) — U.S. Government Accountability Office (2025)
- S055 · www.worldbank.org — The PEACE Project: Factsheet — World Bank (2025-09-25)
- S056 · www.csis.org — Where Is the Missing $100 Billion in U.S. Aid for Ukraine? — CSIS (2025-02-11)
- S057 · www.csis.org — How Supporting Ukraine Is Revitalizing the U.S. Defense Industrial Base — CSIS (2024-04-18)
- S058 · www.congress.gov — Defense Production for Ukraine: Background and Issues for Congress (R48182) — Congressional Research Service (2024-09-16)
- S059 · www.osw.waw.pl — Operation Midas: the largest corruption scandal within Zelensky’s inner circle — OSW Centre for Eastern Studies (Poland) (2025-11-13)
- S060 · www.osw.waw.pl — Hell has frozen over: Head of the Office of the President of Ukraine Andriy Yermak resigns — OSW Centre for Eastern Studies (Poland) (2025-12-01)
- S061 · theins.press — “Midas” vs. Mindich: How Ukraine’s NABU executed the biggest anti-corruption operation in its history - and why the EU is getting involved — The Insider (2025)
- S063 · www.themoscowtimes.com — Ex-Deputy Defense Minister Timur Ivanov Sentenced to 13 Years in Prison — The Moscow Times (2025-07-01)
- S064 · www.occrp.org — Former Russian Deputy Defense Minister Sent to Prison Amid Wartime Corruption Crackdown — OCCRP (2025-07)
- S068 · www.sipri.org — SIPRI Top 100 arms producers see combined revenues surge as states rush to modernize and expand arsenals — Stockholm International Peace Research Institute (SIPRI) (2025-12)
- S069 · www.sipri.org — SIPRI Fact Sheet: The SIPRI Top 100 Arms-Producing and Military Services Companies 2024 — Stockholm International Peace Research Institute (SIPRI) (2025-12)
- S070 · energyandcleanair.org — Financing Putin’s war on Europe: fossil fuel imports from Russia during the invasion of Ukraine — Centre for Research on Energy and Clean Air (CREA) (continuously updated)
- S074 · www.cbr.ru — Bank of Russia key interest rate decisions (press releases) — Bank of Russia (Central Bank of the Russian Federation) (2026-09-11)
- S075 · www.osw.waw.pl — Russia’s 2026 budget: mounting financial challenges and economic stagnation — OSW Centre for Eastern Studies (Poland) (2025-12-09)
- S080 · tass.com — Russian finance ministry has submitted budget package to government: what is known — TASS (Russian state news agency) (2026-09)
- S081 · www.rand.org — The Russian Federal Budget 2025-2027: Expert Insights — RAND Corporation (Mark Stalczynski) (2026)
- S083 · www.ukrinform.net — 2027 state budget draft: what revenue and expenditure is Ukraine expecting? — Ukrinform (Ukrainian state news agency) (2026-09)
- S084 · hromadske.ua — Ukraine plans to spend nearly 44% of GDP on defense in 2027 — Hromadske (2026-09-16)
- S085 · kyivindependent.com — Putin claims Wagner Group was fully funded by state — Kyiv Independent (2023-06-27)
- S087 · www.euronews.com — Orban opposes the EU’s 50 billion support plan for Ukraine while Fico raises corruption concern — Euronews (2023-10-27)
- S089 · www.pravda.com.ua — Slovakia’s new Prime Minister calls Ukraine most corrupt country in the world — Ukrainska Pravda (2023-10-27)
- S090 · www.congress.gov — Oversight, Transparency, and Accountability of Ukraine Assistance — U.S. House of Representatives (118th Congress) (2023-03-29 (hearing; transcript published 2024))
- S096 · internationalpolicy.org — Maintaining Transparency in US Security Assistance to Ukraine — Patrick Bodovitz, Center for International Policy (Security Assistance Monitor) (2024-10-17)
- S097 · www.osw.waw.pl — A bitter compromise over the EU’s financial assistance to Ukraine — OSW Centre for Eastern Studies (Poland) (2025-12-19)
- S098 · www.consilium.europa.eu — Council finalises €90 billion support loan to Ukraine — Council of the EU (Consilium) (2026-04-23)
- S100 · www.kyivpost.com — Key Figures of Ukraine’s 2026 Wartime Budget — Kyiv Post (2025-12)
- S101 · ces.org.ua — What’s changing in Ukraine’s 2026 state budget? — Centre for Economic Strategy (Ukraine) (2025)
- S104 · www.cnbc.com — Indian Prime Minister Modi asks Putin to end Ukraine war amid U.S. tariff threat on Russian oil — CNBC (2026-09-01)
- S108 · thediplomat.com — EU Sanctions Envoy Asks Kyrgyzstan to Stop Helping Russia Dodge Sanctions — The Diplomat (2026-02)
- S109 · www.nortonrosefulbright.com — Beyond the ‘no-Russia’ clause: Kyrgyzstan becomes the first test case for the EU’s anti-circumvention tool — Norton Rose Fulbright (law firm client briefing) (2026)
- S112 · ua.news — Russia will set its budget deficit for 2027 at 2% of GDP, or 4.8 trillion rubles — UA.News (2026-09)
- S113 · carnegieendowment.org — New Budget Confirms the Russian Public Is Paying for the War — Carnegie Endowment for International Peace (2025-10)
- S114 · www.kielinstitut.de — Ukraine Support Tracker: Europe leads on aid – US weapons remain key (press release, 13 August 2026) — Kiel Institute for the World Economy (2026-08-13)
- S115 · www.kielinstitut.de — Europe Steps Up: Ukraine Support After Four Years of War (Kiel Policy Brief 02/2026) — Trebesch, C.; Nishikawa, T. (Kiel Institute) (2026)
- S117 · www.sipri.org — Trends in World Military Expenditure, 2025 (SIPRI Fact Sheet) — SIPRI (2026-04)
- S118 · www.sipri.org — Global military spending surges (SIPRI press release, April 2026) — SIPRI (2026-04)
- S124 · meduza.io — Russia plans to run budget deficits for the next three years with a combined shortfall of nearly 16 trillion rubles — Meduza (2026-09-30)
- S126 · novayagazeta.eu — Nearly 40% of Russian budget earmarked for military and police from next year — Novaya Gazeta Europe (2025-09-30)
- S127 · www.themoscowtimes.com — Russia’s hidden war debt creates a looming credit crisis — Ben Aris, bne IntelliNews (partner content published by The Moscow Times) (2025-01-14)
- S133 · mod.gov.ua — Defense and security expenditures increased by UAH 1.56 trillion — Ministry of Defence of Ukraine (2026)
- S136 · breakingdefense.com — Russia overtakes all of Europe on defense spending in key metric: IISS Military Balance — Breaking Defense (2025-02)
- S137 · www.oversight.gov — Operation Atlantic Resolve: Lead IG Quarterly Report, April 1 - June 30, 2026 — Lead Inspector General (DoD, State, USAID OIGs) (2026-08)
- S146 · euromaidanpress.com — Denmark to spend about $1.6bn this year on weapons production by Ukrainian defense industry — Euromaidan Press (2025-08-29)
- S147 · nako.org.ua — What is the Danish model and why is it beneficial for Ukraine — NAKO (Independent Anti-Corruption Commission) (2025)
- S148 · www.rferl.org — Czech initiative criticized for costs, quality, and delays — but keeps ammo flowing to Ukraine — RFE/RL (Schemes) (2025)
- S150 · ukrinform.net — Pentagon highlights states benefiting from US funding to arm Ukraine — Ukrinform citing Pentagon (2024)
- S151 · militarnyi.com — USA names the U.S. states that benefit most from military aid to Ukraine — Militarnyi (2024)
- S154 · english.nv.ua — Ukraine receives $690 million in second IMF tranche — NV (2026)
- S155 · www.sipri.org — Trends in International Arms Transfers, 2025 (SIPRI Fact Sheet) — SIPRI (2026-03)
- S156 · www.rheinmetall.com — Rheinmetall: half-yearly financial report H1 2026 (news) — Rheinmetall AG (2026-08-06)
- S158 · tradersunion.com — Lockheed, RTX raise 2026 outlook on Pentagon demand (Reuters, syndicated) — Reuters (syndicated) (2026-07)
- S159 · finance.yahoo.com — RTX lifts profit, revenue forecasts amid strong demand for weapons — Reuters (via Yahoo Finance) (2026-04-21)
- S161 · www.aljazeera.com — War-driven demand boosts profits for weapons and aircraft manufacturers — Al Jazeera (2026-04-23)
- S162 · www.defensenews.com — Czechoslovak Group plans stock market listing amid Europe defense boom — Defense News (2026-01-15)
- S163 · www.intellinews.com — Czechoslovak Group reportedly to launch Amsterdam IPO on January 23 — bne IntelliNews (2026-01)
- S164 · newsletter.hntrbrk.com — CSG: Why the largest military IPO in European history is combusting — Hunterbrook (2026)
- S165 · www.themoscowtimes.com — Russia’s Rostec says profit slumped 42% as sanctions, debt weigh on state industrial giant — The Moscow Times (2026-07-15)
- S166 · militarnyi.com — Net profit of Russia’s largest defense holding Rostec falls by 42% — Militarnyi (2026-07)
- S167 · www.pravda.com.ua — Zelenskyy: Ukraine’s drone and missile output could reach $35 billion in 2026 — Ukrainska Pravda (2025-10-06)
- S168 · euromaidanpress.com — How Ukraine came to build more weapons than it can fund — Euromaidan Press (2026-07-15)
- S169 · kyivindependent.com — Exclusive: Maker of Ukraine’s prized Flamingo cruise missile facing corruption probe — Kyiv Independent (2025-08-29)
- S176 · energyandcleanair.org — Fourth year of full-scale invasion: Russian fossil fuel revenues tank to 27% below pre-invasion levels — CREA (2026-02-24)
- S177 · energyandcleanair.org — CREA press release: four years of invasion (24.02.2026) — CREA (2026-02-24)
- S183 · www.ukrinform.net — EU approves phased ban on Russian gas imports by 2027 — Ukrinform (2025-2026)
- S186 · www.brookings.edu — The race to sanction Russia’s growing shadow fleet — Brookings Institution (2025)
- S187 · www.occrp.org — European ships keep Russia’s shadow fleet afloat — OCCRP (2025)
- S188 · data.consilium.europa.eu — Temporary solidarity contribution — Council document ST 9076 2025 INIT — Council of the EU (2025)
- S189 · notesfrompoland.com — Norway should share ‘gigantic’ gas and oil profits from Ukraine war, says Polish PM — Notes from Poland (2022-05-22)
- S191 · www.intellinews.com — Russian gas transit through Ukraine ends, with Europe meeting the new year with 5% less gas — bne IntelliNews (2025-01-01)
- S192 · www.bruegel.org — The end of Russian gas transit via Ukraine and options for the EU (PDF) — Bruegel (2024-10-17)
- S193 · archive.kyivpost.com — Nation’s gas trade has volatile history rife with murky dealings — Kyiv Post (archive) (2011)
- S194 · jamestown.org — The role of Russian organized crime in the gas war of January 2009 — Jamestown Foundation (2009)
- S196 · www.oaklandinstitute.org — War and Theft — FAQ — Oakland Institute (2023)
- S197 · www.kyivpost.com — Russia stole 15M tons of Ukrainian grain since 2022, Kyiv official says — Kyiv Post (2025)
- S198 · www.bakermckenzie.com — Dobra Lithium Holdings JV / metallic minerals PSA tender — Baker McKenzie (2026-01)
- S201 · cf.euroclear.com — Euroclear: strong first quarter results 2025 — Euroclear (2025-05-14)
- S204 · www.rbinternational.com — RBI preliminary results 2025 — Raiffeisen Bank International (2026-02)
- S205 · www.rbinternational.com — RBI H1 2025 results — Raiffeisen Bank International (2025-07)
- S206 · www.intellinews.com — Austria’s RBI ups profit in Russia in 1Q25 — bne IntelliNews (2025-04)
- S207 · b4ukraine.org — Don’t let Raiffeisen use Austrian courts to bail out its Russia business — B4Ukraine coalition (2025)
- S208 · globaltradealert.org — Russia: Putin’s decree puts Fortum Russia B.V. under temporary fiduciary management — Global Trade Alert (2023)
- S209 · globaltradealert.org — Russia: government places foreign stakes in Danone Russia and Baltika under temporary government control — Global Trade Alert (2023)
- S212 · english.nv.ua — Ukraine restructures debt: 37% write-off and new bond terms — NV (2024-07)
- S215 · interfax.com — UK Supreme Court sends Ukraine-Russia dispute over $3bn Eurobonds to full public trial — Interfax-Ukraine (2023-03-15)
- S217 · interfax.com — Ukraine raises tax on bank profits — Interfax-Ukraine (2023)
- S219 · www.elliptic.co — The rise of A7A5: the ruble stablecoin now transfers $1 billion per day — Elliptic (2025)
- S220 · cointelegraph.com — UK sanctions Kyrgyz bank, $9.3bn crypto network used by Russia — Cointelegraph (2025)
- S222 · institute.kse.ua — KSE Institute: regular digest on impact of foreign companies’ exit on RF economy — KSE Institute (2026)
- S223 · www.pravda.com.ua — BlackRock halts talks on investment fund for Ukraine after Trump’s victory – Bloomberg — Ukrainska Pravda citing Bloomberg (2025-07-05)
- S226 · ridl.io — Putin’s deathonomics — Riddle (2024)
- S227 · novayagazeta.eu — Russian regions raise military recruitment bonuses as enlistment falls — Novaya Gazeta Europe (2026-07-30)
- S229 · cbr.ru — Monetary Policy Guidelines for 2027–2029 — Bank of Russia (2026)
- S230 · meduza.io — Russians pick up the tab — Meduza (2025-09-26)
- S231 · www.themoscowtimes.com — Record 155 Russians make Forbes billionaires list — The Moscow Times citing Forbes (2026-07-08)
- S232 · home.treasury.gov — Treasury sanctions illicit gold companies funding Wagner forces — U.S. Department of the Treasury (2023-06-27)
- S233 · www.occrp.org — Leaked Russian records reveal obscure firms helping bust oil sanctions on North Korea — OCCRP (2025)
- S235 · en.lb.ua — Hackers revealed information on the cost Russia paid for Iranian drones — LB.ua (2024-02-06)
- S236 · www.themoscowtimes.com — Russia funding pensions in Donetsk and Luhansk, ex-official claims — The Moscow Times (2016-10-06)
- S237 · www.unian.info — Bild: Russia spends about EUR 79 mln on Donbas salaries, pensions per month — UNIAN citing Bild (2016)
- S238 · www.pravda.com.ua — Putin decrees Zaporizhzhia NPP to be handed over to Russia — Ukrainska Pravda (2022-10-05)
- S239 · meduza.io — Russian official says Moscow will not restore Azovstal — Meduza (2023-01-24)
- S240 · kyivindependent.com — Ukraine’s top oligarch Akhmetov loses half his assets to Russia’s invasion — Kyiv Independent (2022)
- S242 · euneighbourseast.eu — Ukraine — Fifth Rapid Damage and Needs Assessment (RDNA5) — World Bank / EU / UN / Government of Ukraine (EU Neighbours East copy) (2026-02)
- S245 · unn.ua — URC 2026 donor conference starts in Gdańsk with a focus on Ukraine’s recovery — UNN (2026-06)
- S247 · www.ebrd.com — EBRD and EU launch new programme to support Ukraine’s private sector — EBRD (2026)
- S250 · inventure.com.ua — URIF forms first portfolio of eight projects worth $1.2 billion — Inventure (2026)
- S251 · inventure.com.ua — Nestlé bets on Ukraine as investment is set to reach UAH 10 billion — Inventure (2025)
- S252 · www.rheinmetall.com — Rheinmetall and Ukrainian Defense Industry joint venture (press release PDF) — Rheinmetall AG (2024-02-19)
- S253 · rubryka.com — Baykar aims to finish drone plant construction in Ukraine in 2025 — Rubryka (2024-10-28)
- S257 · www.slovoidilo.ua — NABU says it investigates more than 10 cases of abuse in fortification construction — Slovo i Dilo citing NABU (2025-11-25)
- S258 · www.open-contracting.org — The Ukrainian DREAM: making wartime reconstruction digital and accountable — Open Contracting Partnership (2023-08-14)
- S259 · baselgovernance.org — Safeguarding Ukraine’s Restoration — Basel Institute on Governance (2024-03)
- S260 · ktvz.com — Fact check: Trump repeats false Ukraine aid figure while sitting with Zelensky — CNN (via KTVZ) (2025-08-18)
- S261 · kyivindependent.com — Explainer: Did Trump lie about $350 billion aid to Ukraine, and does Kyiv have to repay it? — Kyiv Independent (2025-02)
- S263 · www.smallarmssurvey.org — Weapons Compass: proliferation and control of arms and ammunition in wartime Ukraine — Small Arms Survey / CENSS (2025-12)
- S265 · leadstories.com — Fact check: Zelenskyy did NOT buy a $20 million mansion in Vero Beach, Florida — Lead Stories (2023-12)
- S267 · www.euronews.com — Zelenskyy once again hit with false property empire allegations — Euronews (EuroVerify) (2025-09-02)
- S270 · kcrg.com — Senate committees release report on Hunter Biden conflicts of interest investigation — AP (via KCRG) (2020-09-23)
- S271 · www.politifact.com — Looking at claims about Hunter Biden and the Senate GOP report — PolitiFact (2020-10-19)
- S276 · institute.kse.ua — State debt review 2025 — KSE Institute (2026-05)
- S278 · www.kyivpost.com — Ukrainian banks’ profits 2024 (Kyiv Post) — Kyiv Post (2025)
- S282 · www.eeas.europa.eu — Commission disburses the first €3.2 billion instalment to Ukraine under the €90 billion Ukraine Support Loan — EU Delegation to Ukraine / European Commission (2026-06)
- S284 · www.encyclopediaofukraine.com — Kharkiv Pact (Encyclopedia of Ukraine) — Encyclopedia of Ukraine (CIUS) (undated)
- S285 · archive.kyivpost.com — Azarov: Ukraine signed Kharkiv accords in hope of reducing gas price — Kyiv Post (archive) (2012)
- S286 · www.aljazeera.com — Russia and Ukraine strike $15bn deal — Al Jazeera (2013-12-18)
- S287 · www.cnbc.com — Russia reaches deal with Ukraine on $15 billion bailout — CNBC (Reuters) (2013-12-17)
- S288 · www.everycrsreport.com — U.S. Security Assistance to Ukraine (CRS In Focus IF12040, version of 24 June 2022) — Congressional Research Service (EveryCRSReport copy) (2022-06-24)
- S291 · blackseanews.net — Investment. What the ‘Crimean’ Federal Target Programme finances / 2014-2021 — BlackSeaNews (2021)
- S292 · www.aap.com.au — Not a grain of truth in Ukrainian farmland claim — AAP FactCheck (2022-08-21)
- S294 · cf.euroclear.com — Euroclear: results for the first half year ended 30 June 2026 — Euroclear (2026-07-17)
- S295 · cf.euroclear.com — Euroclear: results for the year ending 31 December 2025 (cf mirror) — Euroclear (2026-02-04)
- S297 · www.polskieradio.pl — EU governments agree to indefinitely freeze Russian assets — Polskie Radio (2025-12)
- S298 · www.intellinews.com — EU outlines structure of reparations loan backed by frozen Russian assets for Ukraine — bne IntelliNews (2025)
- S299 · meduza.io — Euroclear rejects Moscow ruling seeking massive damages, keeps Russian assets frozen — Meduza (2026-05-19)
- S300 · meduza.io — Moscow appeals court upholds 18.17 trillion ruble order against Euroclear — Meduza (2026-07-16)
- S301 · www.malaymail.com — Foreign firms’ losses from exiting Russia top US$107 billion — Reuters (via Malay Mail) (2024-03-28)
- S302 · www.blackrock.com — BlackRock Financial Markets Advisory to advise Ministry of Economy of Ukraine — BlackRock (2022-11-10)
- S304 · www.cnbc.com — Ukraine plots post-war rebuilding effort with JPMorgan Chase as economic advisor — CNBC (2023-02-13)
- S305 · www.pravda.com.ua — Zelensky and JP Morgan sign memorandum on reconstruction (Ukrainska Pravda) — Ukrainska Pravda (2023-02-11)
- S306 · interfax.com — Sberbank 9M 2025 IFRS results (Interfax) — Interfax (2025-10-28)
- S307 · navigatingrussia.substack.com — Russia’s hidden war debt (full report) — Craig Kennedy, Navigating Russia (2025-01)
- S309 · www.oilandgas360.com — Russia’s oil and gas budget revenue falls 24% to lowest since 2020 — Reuters (via Oil & Gas 360) (2026-01)
- S310 · meduza.io — Russia on track to spend 2 percent of GDP on military personnel this year — Re:Russia — Meduza citing Re:Russia (2025-07-10)
- S312 · meduza.io — Russia’s payments to soldiers and their families amount to eight percent of federal spending, study finds — Meduza (2024-07-17)
- S313 · www.euronews.com — Russia cuts troop bonuses and delays death benefits amid budget shortfalls — Euronews (2025-12-02)
- S315 · acer.europa.eu — Analysis of the European LNG market developments 2026 — ACER (EU Agency for the Cooperation of Energy Regulators) (2026)
- S316 · www.marineinsight.com — EU keeps Russian LNG flowing in 2025, spending €7.2 billion ahead of 2027 import ban — Marine Insight (2026)
- S317 · www.euronews.com — Two thirds of Europe’s LNG imports to come from the US amid increased reliance — Euronews (2026-05-13)
- S322 · finance.yahoo.com — Rheinmetall overtakes Volkswagen’s market value as defence rally continues — Reuters (via Yahoo Finance) (2025)
- S323 · babel.ua — Europol officially commented on statements about alleged ‘signs of arms trade from Ukraine’ — Babel (2022)
- S325 · www.nato.int — Wales Summit Declaration — NATO (2014-09-05)
- S326 · www.nato.int — Defence investment and NATO’s 5 % commitment — NATO (undated)
- S328 · nato.int — Defence Expenditure of NATO Countries (2014-2025) — data tables PDF — NATO (2025)
- S330 · eda.europa.eu — EDA Defence Data 2023-2024 — European Defence Agency (2024)
- S333 · www.nato.int — The Hague Summit Declaration — NATO (2025-06-25)
- S336 · notesfrompoland.com — Poland allocated largest share of new EU defence programme with €44bn in loans — Notes from Poland (2025-09-09)
- S337 · www.defensenews.com — Countries flock to claim EU defense loans; Poland gets lion’s share — Defense News (2025-09-10)
- S339 · defensearchives.com — United States arms sales experience continued growth in Fiscal Year 2025 — Defense Archives (2025-12)
- S340 · www.sipri.org — SIPRI Military Expenditure Database, data file 1949–2025 (v1.2) — SIPRI (2026-04)
- S341 · energyandcleanair.org — August 2026 — Monthly analysis of Russian fossil fuel exports and sanctions — CREA (2026-09)
- S342 · energyandcleanair.org — July 2026 — Monthly analysis of Russian fossil fuel exports and sanctions — CREA (2026-08)
- S343 · www.everycrsreport.com — U.S. Security Assistance to Ukraine (CRS In Focus IF12040, version of 29 April 2022) — Congressional Research Service (EveryCRSReport copy) (2022-04-29)
- S344 · www.pbs.org — Ukraine receives first payment as part of Russian bailout — PBS NewsHour (AP) (2013-12-24)
- S345 · ec.europa.eu — Commission press release IP/22/1670 (EU support to Ukraine, March 2022) — European Commission (2022-03)
- S346 · euromaidanpress.com — What assets did Russia’s puppet republics seize from Ukraine? Full list — Euromaidan Press (2017-03-04)