Key findings
Germany in focus · Comparisons with Poland, the EU and the US · Evidence cutoff: 10 September 2026
Crude oil is only one part of the fuel price. The amount paid at a German filling station also covers processing the oil into fuel, transport, running the station, taxes and business profits. The dollar price of a barrel therefore cannot, on its own, explain the euro price of a litre. Available evidence shows both supply difficulties and substantial company earnings. It does not show that every price increase reflects an unavoidable cost.
The historical comparison depends on the year and currency. In 2012, Brent crude averaged USD 111.63 per barrel and German E10 petrol EUR 1.589 per litre. In 2016, ten years before this report, Brent averaged USD 43.64. In 2025, E10 cost EUR 1.688. After allowing for the general rise in German consumer prices, the 2012 petrol price was equivalent to EUR 2.112 in 2025. Fuel was therefore cheaper in 2025 on that measure, although the price displayed at stations was higher. S02 S04 S25
Current prices require a separate comparison. On 8 September 2026, the US Energy Information Administration (EIA) recorded WTI crude at USD 94.21 and Brent at USD 106.12 per barrel. These are different crude-oil price references. ADAC reported German E10 at EUR 2.259 and diesel at EUR 2.321 per litre on 9 September. These short-period observations are not annual averages. S01 S03
Taxes and carbon-related charges account for a large share. Of the European Commission’s German petrol price of EUR 2.331 per litre on 7 September, about 117.49 cents went to public charges and 115.61 cents covered the fuel, business costs and earnings. Public charges represented about 50.4% of petrol’s price and 43.1% of diesel’s. The amount left after these charges is not company profit. S06 S07 S08 S09 S10 S11 S12
Several parts of the industry report substantial earnings. BP, Shell, Aramco, ORLEN and Trafigura disclose profits from different activities and countries. Their accounts do not identify the profit on an individual German litre. Germany’s competition authority, the Bundeskartellamt, was still examining refinery pricing at the cutoff; whether relevant abuse occurred remained unresolved. S31 S32 S33 S36 S42 S44 S48
Assessment and limits. Exchange rates, taxes and fuel supply explain important parts of the price difference. Profits and competition also require examination. This analysis uses official data, company disclosures, regulatory reports and studies with differing results. Calculations and source links were checked with AI assistance. The publisher approved publication on 10 September 2026. Public evidence does not support an exact “fair price” or a complete allocation of profit to each recipient.
1. Comparing the same prices
Crude oil is the raw material. Petrol and diesel are finished products with their own markets. WTI and Brent are two widely used reference prices for crude from different markets. Neither is the purchase price of every shipment reaching Germany. Oil quality, delivery location, transport and contract terms can change the price a refinery pays.
| Observation | Price | Date and meaning |
|---|---|---|
| WTI crude | USD 94.21 per barrel | EIA price for near-term supply, 8 September 2026 |
| Brent crude | USD 106.12 per barrel | Same EIA observation |
| German E10 petrol | EUR 2.259 per litre | ADAC national observation, 9 September |
| German diesel | EUR 2.321 per litre | Same ADAC observation |
| German Euro-super 95 petrol | EUR 2.331 per litre | European Commission observation, 7 September |
| German diesel, Commission series | EUR 2.328 per litre | Same Commission observation |
Sources: S01 S03 S06. A barrel contains approximately 159 litres of crude oil; it does not produce 159 litres of petrol.
E5 and E10 are different petrol blends. The European Commission’s German country note identifies its Euro-super 95 series as E5, whereas the ADAC series used here is E10. The German note describes a simple average of reported prices. The Polish note gives greater weight to suppliers with larger market shares. Both notes date from 2018; some details may since have changed. These series cannot be combined into one continuous series without adjustment, and their difference is not a measure of profit. S20 S21
A further source difference remains unresolved. ADAC’s 9 September commentary described Brent as just below USD 100, while EIA reported USD 106.12 for 8 September. Different observation times or types of price quotation may contribute, but this was not established. Calculations below use the explicitly dated EIA observations. S01 S03
Reliable comparisons need the same country, fuel type, tax treatment, currency and period. A motorway price, a loyalty discount and a national average measure different things. An annual average also cannot establish the price paid on a particular journey.
2. Historical prices
| Year | Brent, USD per barrel | WTI, USD per barrel | German E10, EUR per litre | German diesel, EUR per litre |
|---|---|---|---|---|
| 2012 | 111.63 | 94.05 | 1.589 | 1.478 |
| 2014 | 98.97 | 93.17 | 1.493 | 1.350 |
| 2016 | 43.64 | 43.29 | 1.281 | 1.078 |
| 2022 | 100.93 | 94.90 | 1.860 | 1.946 |
| 2025 | 69.14 | 65.39 | 1.688 | 1.611 |
Annual averages for selected years. Sources: ADAC S02 and EIA S04 S05. The table does not show every change between these years.
The 2012 figures support the observation that expensive crude once coincided with lower German pump prices. They do not support describing that period as “ten years ago”. In 2016, crude was much cheaper. Comparing historical Brent with present-day WTI introduces another difference: in 2012, Brent was USD 17.58 per barrel more expensive than WTI on average.
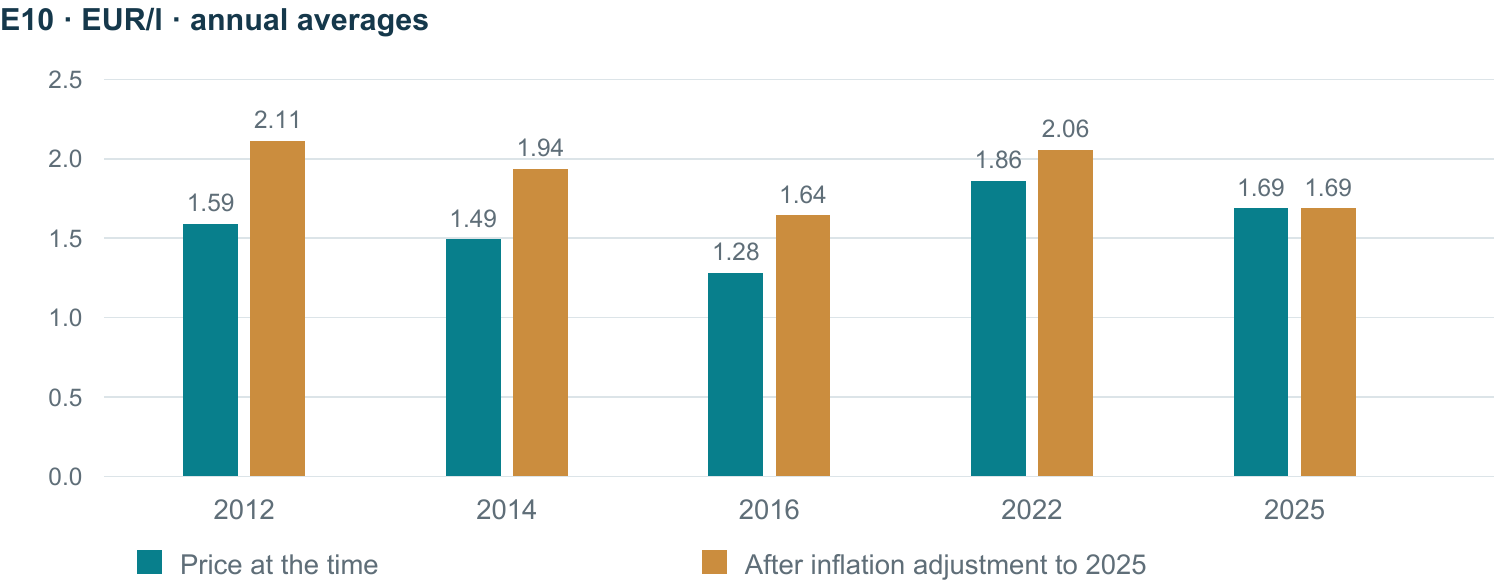
The chart distinguishes the amount paid at the time from its equivalent after allowing for the general rise in consumer prices. On the second measure, petrol was cheaper in 2025 than in 2012. September 2026 prices were much higher, but they are not a full-year average. Diesel also followed a different pattern: in 2022 it cost more than petrol despite Germany’s lower energy-tax rate for diesel.
An exact historical purchase at an oil price of USD 112–120 cannot be reconstructed without its date, location and receipt. The annual data test the broader comparison without assuming details of an individual journey.
3. Exchange rates and inflation
Crude oil is commonly priced in dollars. A German buyer therefore also faces changes in the euro–dollar exchange rate. “USD per EUR” means the number of dollars one euro buys. A lower number makes the same dollar-priced purchase more expensive in euros.
The following calculation expresses a barrel’s value in euros per litre of crude:
Dollars per barrel ÷ dollars per euro ÷ 159.
It is a comparison of raw-material prices, not a calculation of the crude cost in a litre of petrol. Refineries produce several saleable products and use energy and other materials in doing so.
| Period | Dollars bought by one euro | Brent value, euro cents per litre of crude |
|---|---|---|
| 2012 annual average | 1.2848 | 54.64 |
| 2014 annual average | 1.3285 | 46.85 |
| 2016 annual average | 1.1069 | 24.80 |
| 2022 annual average | 1.0530 | 60.28 |
| 2025 annual average | 1.1300 | 38.48 |
| 8 September 2026 | 1.1614 | 57.47 |
Calculated from S03 S04 S24. The annual rows divide two annual averages. They approximate the result of converting every daily price separately. The September row uses observations from the same day, not necessarily the same time of day.
Between 2012 and 2022, Brent fell from USD 111.63 to USD 100.93 per barrel. Yet its euro value per litre rose from 54.64 to 60.28 cents. The weaker euro more than offset the fall in the dollar price.
Inflation answers a different question: how does an old price compare after allowing for the general rise in the cost of living? Germany’s consumer price index rose from 91.7 in 2012 to 121.9 in 2025, with 2020 set to 100. The calculation is 1.589 × 121.9 ÷ 91.7 = EUR 2.112. The actual 2025 petrol price of EUR 1.688 was about 20% lower than that adjusted 2012 price. S25
This does not mean refinery costs rose by the same percentage. Nor does it establish whether fuel became more affordable for every household. That would also require income, driving-distance and vehicle-efficiency data. The 2025 index is not used here to draw an inflation-adjusted conclusion about 2026.
4. From oil production to the filling station
| Stage | Main activity | Costs and possible earnings |
|---|---|---|
| Finding and developing oil fields | Locate oil, obtain rights, drill and build facilities | Surveys, unsuccessful projects, equipment, finance and payments to resource owners; possible returns to investors |
| Producing crude oil | Bring oil to the surface and prepare it for transport | Staff, energy, repairs and eventual closure of wells; producer earnings |
| Transporting and trading crude | Buy, store, finance and move oil | Pipelines, ships, terminals, insurance and interest; transport and trading earnings |
| Refining | Process crude into petrol, diesel and other products | Crude, heat, electricity, hydrogen, processing materials, maintenance and equipment; refinery earnings |
| Preparing finished fuel | Blend ingredients and meet quality and renewable-fuel requirements | Ethanol, biodiesel, additives and testing; supplier earnings |
| Wholesale delivery | Supply large quantities of fuel to stations and other buyers | Storage, barges, rail, trucks and finance; wholesale earnings |
| Retail sale | Operate a filling station | Staff, rent, equipment, energy, card fees and losses; operator earnings or commission |
| Public charges | Apply energy tax, VAT and carbon-related payments | Revenue for public budgets and policy programmes |
One company may perform several of these activities. Oil can also change owner without moving. Transfers within the same company group must not be counted as additional costs paid to outsiders.
A refinery first heats and separates crude into different components. Further processing changes some components into more useful fuels and removes unwanted substances. Blending then produces fuel of the required quality. Equipment limits how quickly a refinery can change the amounts of petrol, diesel and aviation fuel it makes. S15 S49
The EIA illustrates the process with US output: a 42-gallon barrel of crude can yield roughly 19–20 gallons of petrol, 11–13 gallons of diesel and similar fuels, and 3–5 gallons of aviation fuel. These are not fixed output figures for German refineries. The other products also earn revenue, so the entire crude purchase cost cannot be assigned to petrol alone. S49
The cost of operating an existing well is also different from the cost of developing new production. In a March 2026 Dallas Federal Reserve survey, respondents reported an average WTI price of about USD 43 to cover existing wells’ operating expenses, and USD 66 to drill profitably. These regional responses are not global production-cost estimates. Subtracting only the cost of operating a well from the oil price would overstate net profit. S41
5. Price setting and the meaning of a margin
Fuel prices are generally not calculated by adding a fixed, regulated profit percentage to the original cost of a barrel. Suppliers consider competing offers, available supply and the cost of buying replacement fuel. A German refinery may be able to sell diesel abroad. An importer must cover the cost of bringing fuel into Germany. These alternatives connect German wholesale prices with international fuel markets. S13 S22
A shortage can increase earnings even for suppliers whose own costs have barely changed. If replacement supplies become expensive, existing suppliers may also obtain the higher market price. Economists call the additional return a scarcity rent. It can arise with effective competition. Weak competition can make it larger or more persistent. A price increase alone does not distinguish these explanations.
A margin is a difference between specified sales receipts and costs. Its meaning depends on which costs have already been deducted:
- The difference between fuel and crude prices is measured before most processing costs.
- A wholesale gross margin deducts a specified purchase cost or reference price from sales receipts. Definitions vary.
- A station’s gross fuel margin deducts fuel purchases from fuel sales revenue excluding taxes. It still has to cover operating the station.
- Net profit deducts the relevant expenses. Company, business-division and accounting definitions must still be checked.
A crack spread is an industry measure comparing the market value of a fixed example mix of fuels with crude oil. EIA’s US Gulf 3:2:1 indicator was USD 58.02 per barrel on 8 September. It is not a German refinery’s actual profit. Energy, wages, maintenance, equipment costs, actual output and price-protection contracts still affect the result. S03
Purchasing contracts, stocks and delivery schedules can delay price changes. Companies may also use hedging: financial contracts intended to reduce the effect of future price changes. Nevertheless, a supplier’s replacement cost can rise before newly purchased oil reaches a station. Existing stocks therefore do not require every price increase to wait, or explain every delay in a price reduction.
To test whether prices rise faster than they fall, an analysis would need to compare increases and decreases in the relevant fuel costs in euros. It would also need to account for taxes, seasons, local competition and transport problems. A chart of WTI and average German pump prices cannot establish this on its own. Such a statistical test was not performed for this report.
Further influences: supply, financial markets and policy
OPEC and the wider OPEC+ group coordinate oil-production targets. Their influence depends on how much additional oil members can produce, whether targets are followed and what other producers supply. These decisions affect crude prices and producer earnings. They do not, by themselves, explain why the gap between crude and German finished-fuel prices widens. No specific recent production decision is assigned a numerical effect here. S52
Spot prices concern near-term supply. Futures prices concern contracts for specified future delivery periods. The relationship between these prices affects decisions to store oil or release stocks. Financial trading helps buyers and sellers manage price risks and also allows speculation on future prices. A gain on a financial contract can offset a loss on oil held in storage. It is not necessarily an additional charge to consumers. Available evidence does not support assigning a fixed “speculation premium” to each litre. S51
Sanctions also changed trade. The EU ban on seaborne Russian crude imports took effect on 5 December 2022. The ban on refined products followed on 5 February 2023. Eurostat documented changes in supplying countries. These import bans differ from the separate price-limit rules for certain services supporting Russian exports to countries outside the EU. S53 S54
Alternative sources, longer routes, insurance and finance can change delivery costs. Their actual contribution needs to be measured. The later import bans cannot be the direct legal cause of every increase in early 2022; expectations and earlier supply disruptions are separate influences.
Petrol and diesel also face different demand. Road freight, industry and demand for related heating fuels affect the diesel market. Petrol demand and quality requirements vary with the season. Enough crude oil may therefore be available while a particular finished fuel is scarce. Blending ingredients have their own prices too. S16 S17 S49
A requirement that has existed for years does not automatically explain a recent price rise. Equally, an emissions charge already included in purchased fuel must not be added again when calculating the final price.
6. The components of a German fuel price
The table breaks down the European Commission’s observation for 7 September 2026. It reconciles published data; it does not examine an individual station’s invoices.
| Component, euro cents per litre | Petrol, Euro-super 95 | Diesel |
|---|---|---|
| Fuel, business costs and earnings, excluding reported public charges | 115.61 | 132.41 |
| Energy tax | 65.45 | 47.04 |
| Other indirect/carbon-related charges reported by the Commission | 14.82 | 16.18 |
| Value added tax (VAT) | 37.22 | 37.17 |
| Pump price | 233.10 | 232.80 |
| Public charges as a share of the pump price | 50.4% | 43.1% |
Sources and calculation: S06 S07 S09 S10 S11 S12. Displayed sums may differ slightly because of rounding.
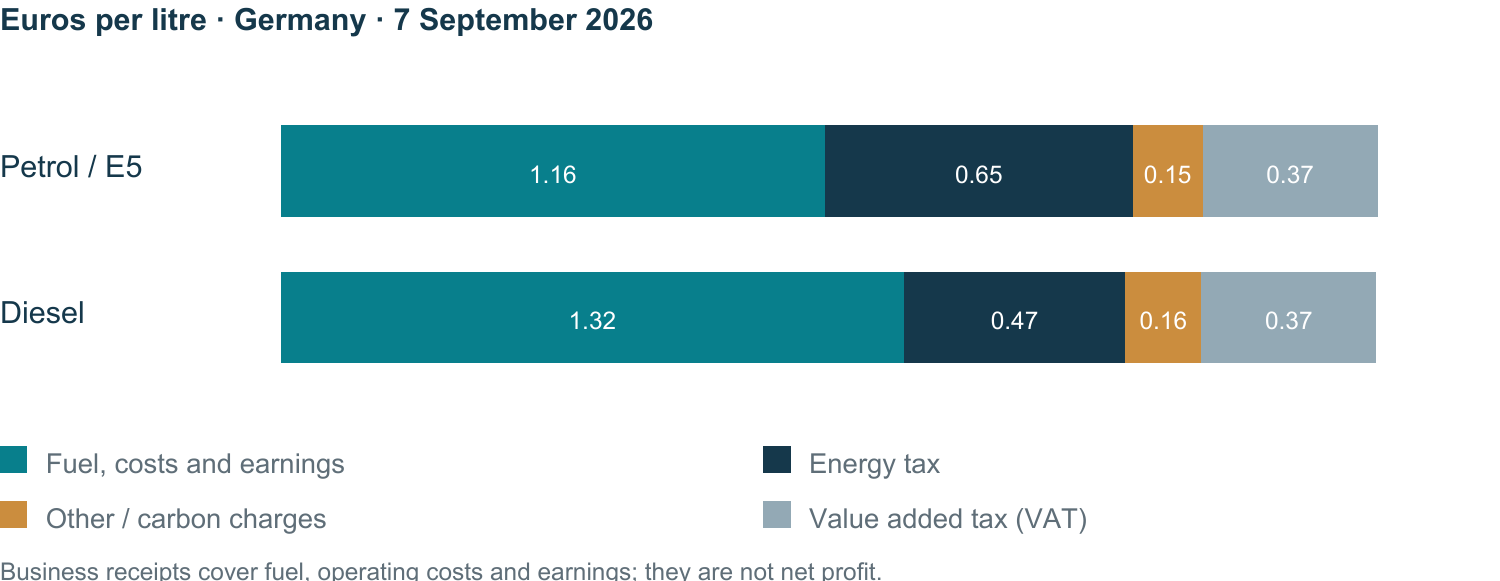
Germany’s VAT rate is 19% of the price before VAT. To find VAT within a price that already includes it, the calculation is price × 19 ÷ 119. Energy tax is also included in the amount on which VAT is charged. A 10-cent increase before VAT therefore adds 11.9 cents at the pump, including 1.9 cents of additional VAT. The fixed energy tax per litre does not rise automatically with crude prices. Total energy-tax revenue also depends on how much fuel is sold.
Germany introduced national carbon pricing in 2021. For 2026, the legal price range is EUR 55–65 per tonne of emissions. The table uses the Commission’s reported carbon-related amounts, which reconcile its prices with and without reported charges. It does not assume that every fuel blend has the same fossil carbon content. Nor does it establish the certificate-purchase cost actually paid by every supplier. S09 S12
The Commission’s separate tax-rate file still contained Germany’s temporary lower energy-tax rates for May–June and a Polish VAT entry of 8%. These entries were not extended to September. Germany’s normal statutory rates and the documented end of the tax reduction match the September price breakdown. S09 S10 S11
The remaining 115.61 cents for petrol and 132.41 cents for diesel cover purchased fuel, processing, transport, station expenses and earnings across the businesses involved. Subtracting a converted WTI price would still not reveal their combined profit.
7. Changes between 2012 and 2026
Exchange rates, general prices and carbon pricing changed. The euro was stronger in 2012. General consumer prices subsequently rose, and Germany introduced national carbon pricing in 2021. Demand and regional fuel supply also changed. These factors help explain higher prices, but they do not quantify or justify every increase in business margins. S02 S12 S24 S25
In 2022, higher costs did not explain the whole difference. The Bundeskartellamt’s interim investigation found that costs alone could not explain fuel prices moving away from crude prices. It also found substantial refinery profits. At that stage, it had found no indications of price agreements. S14 S23
The investigation did not establish a general shortage of worldwide refining capacity as the sole explanation. European diesel imports, regional transport and conditions for individual fuels needed separate examination. The findings therefore do not support attributing all increases to refinery closures. S23, sections on capacity and international trade
In 2026, the evidence includes new supply disruption. The International Energy Agency’s public August overview reported that refineries processed about 80.9 million barrels a day in July, roughly 5 million less than a year earlier. It also described disrupted trade and large gaps between fuel and crude prices. These findings indicate supply pressure; they do not establish the necessary price at a particular German station. The paid full report was not accessed. S26
On 8 September, the Bundeskartellamt reported that the gap between crude and wholesale fuel prices had widened again after late June, especially for diesel. It also identified transport costs caused by low Rhine water levels and regional competition as influences on regional price differences. S44
Temporary tax changes affect short comparisons. Germany reduced energy tax by 14.04 cents per litre before VAT during May–June 2026, equivalent to about 16.7 cents including VAT. That relief ended on 1 July. Comparisons between the relief period and September must allow for the restored tax before attributing the whole price increase to businesses. S11 S47
Exchange-rate and tax effects can be calculated separately. Available evidence does not reliably divide the entire 2012–2026 price increase into percentage contributions from transport, shortages, competition and every other cause.
8. Company earnings at different stages
Company results show substantial earnings at several stages of the industry. The figures below use different periods, currencies and accounting measures. They are not directly comparable and do not show profit per German litre.
“Adjusted” earnings exclude items specified by the reporting company. A result before interest and tax is also different from net profit. These distinctions matter when interpreting the amounts.
| Company and activity | Reported result | Scope and limits |
|---|---|---|
| Aramco: oil production and other energy activities | USD 67.2 billion adjusted net income, first half of 2026 | Global group; adjusted measure S48 |
| Shell: several energy activities | USD 9.8 billion adjusted earnings, April–June 2026 | Includes liquefied natural gas and other businesses S31 |
| BP: refining and trading | USD 5.377 billion underlying replacement-cost profit before interest and tax, first half of 2026; USD 0.490 billion in the first half of 2025 | Global business division; refining and trading reported together S32 |
| ORLEN: several energy activities | PLN 7.7 billion net result; PLN 13.9 billion EBITDA LIFO, April–June 2026 | Two different measures for the same group and period S36 |
| Trafigura: commodity trading | USD 4.1 billion net profit, first half of its 2026 financial year | Six months ending 31 March; includes commodities other than oil S42 |
BP’s measure accounts for specified adjustments and inventory-price effects and is calculated before interest and tax. Its increase concerns activities between crude production and final consumption. However, the combined global result does not separate refining from trading or establish excessive charging in Germany. S32
ORLEN’s EBITDA LIFO is an operating earnings measure before interest, taxes, depreciation and amortisation, with an inventory-valuation adjustment. It is not another net-profit figure. ORLEN also reported that foreign markets provided 43% of profits generated by its filling stations within the relevant segment. It attributed lower Polish fuel margins to its own pricing actions. These are company statements, not independent assessments of a fair price in Poland or Germany. The segment also includes other energy products. S36
Profits can support investment, debt repayment, cash reserves and payments to owners. Aramco reported USD 85.5 billion of shareholder distributions for 2025. Shell announced a USD 3 billion share buyback in July 2026, a purchase of its own shares. These payments use company funds; they must not be counted again as another margin in the fuel price. S33 S31
Trafigura stated that much of its first-half profit had been secured before the Middle East conflict. That timing limits any claim that all of its reported 2026 trading profit resulted from the later crisis. S42
9. Other recipients of fuel revenue
| Recipient | Payment or income received | Important distinction |
|---|---|---|
| States and other holders of resource rights | Payments for extraction rights, production-related payments, taxes and ownership returns | Costs and tax systems differ between producing countries |
| Oil producers and investors | Earnings from crude sales after relevant costs | Operating an existing well is only one cost |
| Refineries, importers and wholesalers | Receipts from processing, purchasing and distributing fuel | The fuel–crude price gap also covers expenses |
| Traders and owners of storage and transport | Trading returns, freight charges, transport tariffs and storage fees | Revenue is not the same as profit |
| Banks, insurers and service suppliers | Interest, insurance premiums, equipment and service payments | These businesses also incur costs |
| Station businesses, landlords and agents | Fuel earnings or commission, rent and income from other services | The local operator may not own the fuel or set its price |
| Employees | Wages and related payments | Employee income is not company profit |
| Governments where fuel is sold | VAT, energy tax and carbon-related revenue | Total receipts also depend on sales volumes and policy changes |
| Final owners, including public owners | Dividends, share buybacks and value retained in companies | These uses of earnings cannot be counted again as a separate margin |
This identifies categories of recipients. Public accounts do not reveal every contract, investor or country-specific profit. They cannot provide an exhaustive named list of everyone benefiting from German fuel sales.
A branded station may be operated by the company, leased to another business or run by an agent. Purchasing and pricing decisions may be made elsewhere. Shops, food and car washes also contribute to the station’s result. A small local fuel commission can therefore coexist with a large profit at group level. EIA describes retail cost categories; the German regulator separately distinguishes station margins before and after operating expenses. S16 S47
Public revenue must be distinguished from business profit. A fuel-price increase can raise VAT per litre, but its total budget effect also depends on lower demand, tax relief and other public spending. Carbon-pricing revenue also funds public programmes. Taxes remain a major part of the price paid by motorists and a policy choice. S11 S12
Climate damage, air pollution and other effects on society are not all reflected in the cash price. They are relevant to policy, but this analysis does not calculate a monetary amount for them per litre or treat them as a company’s production expenses.
10. Competition and the status of investigations
The Bundeskartellamt’s 2025 inquiry identified reasons to examine the market closely: regional supply relationships, companies operating at several stages, and the role of price-reporting services. These services collect market information and publish price assessments used in supply contracts. An assessment can influence many more transactions than those used to calculate it. Limited or selective information creates risks, but a risk is not proof of manipulation. S13 S22
A persistently large gap between crude and fuel prices can have several causes:
- Higher supply costs, including energy, shipping and replacement fuel.
- Short supply that allows suppliers to earn more, even if their own costs have not risen by the same amount.
- Weak competition or unlawful conduct that sustains prices above the level expected with effective competition.
These causes can overlap. Higher costs do not rule out competition problems, and high profits alone do not prove unlawful behaviour. A legal assessment requires evidence about conduct and market position.
On 5 May 2026, the Düsseldorf Higher Regional Court described interim restrictions on demands for information identifying the sources used by price-reporting companies. The court raised legal concerns about the demands, including whether they were proportionate and sufficiently protected sources. It did not determine that pump prices were competitive or prohibit all fuel-market investigations. S43
The Bundeskartellamt’s 8 September statement described continuing refinery-pricing proceedings. Those proceedings were to establish whether relevant abuse had occurred. Their final outcome was not established at the report’s cutoff. S44
Since 1 April 2026, German stations have been allowed to increase prices only at noon, while reductions remain possible at other times. Fewer price changes do not themselves establish lower average prices. Measuring the rule’s effect requires estimating what prices would have been without it. S11 S47
The evidence supports scrutiny of the business portion of fuel prices. It does not establish that named companies jointly fixed the observed price or that a specified percentage of it was unlawful.
11. How much tax relief reached motorists
A tax reduction can lower fuel prices. To measure how much of it reached motorists, the observed price must be compared with an estimate of the price without the reduction. That second price cannot be observed directly. Results therefore depend on the method. A simple before-and-after comparison also captures changes in wholesale prices.
| Period and study | Estimated reduction reaching motorists | Main limitation |
|---|---|---|
| Germany 2022, ifo Dresden | Approximately the full tax reduction over the whole relief period | The amount varied within the period; the comparison method matters S27 |
| Germany 2022, RWI study reported in 2024 | 87% for diesel; 71% for E10 | Different analysis of periods and regions; regional variation S29 |
| Germany May–June 2026, cost model of the regulator’s fuel-market monitoring unit (MTS-K) | 13.8 cents per litre for diesel, or 82.6%; 13.0 cents for E5, or 77.8% | Assumes gross margins based on January–March S47, p. 7 |
| Same 2026 period, ifo estimates reported by MTS-K | 12.1 cents for diesel; 16.4 cents for E5; 15.3 cents for E10 | Uses France to estimate German prices without relief; figures cited through the regulator’s report S47, p. 10 |
The results should not be averaged into a single figure. The ifo paper published in June 2026 covered an earlier period and found that more of the relief reached motorists during May. It does not provide a final estimate for the whole of May–June. S28
The regulator’s model estimated that station gross margins, before operating expenses, rose by about 3.3 cents per litre for diesel and 1.9 cents for E5 in May–June compared with January–March. It assigned much of the diesel shortfall to retail pricing. For E5, both wholesale and retail pricing contributed. It did not establish changes in station net margins. S47, p. 9
These findings make retail pricing relevant to the assessment. They do not mean every station retained the same amount as profit. Purchase costs, local supply and operating expenses vary. The January–March comparison period also spans the start of the 2026 conflict.
The France comparison has a different limitation. French prices must reasonably represent how German prices would have developed without relief. Different local supply, taxes or voluntary price limits can weaken that assumption.
The studies indicate that substantial relief reached motorists. The estimated amount, and the stage at which some relief was not passed on, depend on fuel type, period and method. The differences warrant further examination, rather than an exact accusation based on a single model.
12. Germany, Poland, the EU and the US
| Market | Petrol, EUR per litre | Diesel, EUR per litre | Reference |
|---|---|---|---|
| Germany | 2.331 | 2.328 | European Commission, 7 September |
| Poland | 1.812 | 1.982 | Same source and date |
| EU aggregate | 2.042 | 2.107 | Commission history file, same date |
| United States | 0.960 | 1.351 | Approximate conversion of US regular petrol and diesel prices, 8 September |
European data: S06 S08. US prices were USD 4.22 and USD 5.94 per US gallon in EIA’s observation, sourced from AAA S03. Conversion uses 3.785411784 litres per US gallon and 1.1614 dollars per euro S24. The EU figure is the source’s aggregate, not a new simple average. US fuel grades and taxes differ. The table compares monetary prices, not identical fuel quality or household affordability.
For petrol, Germany’s price exceeded Poland’s by 51.94 euro cents per litre. Reported public charges accounted for 41.40 cents of that difference; prices excluding those charges accounted for 10.53 cents. For diesel, the respective figures were 34.60, 24.04 and 10.56 cents. Tax differences therefore account for about 80% of the petrol gap and 69% of the diesel gap in this observation. Small differences in displayed totals reflect rounding. S06 S07
The remaining difference covers fuel purchases, distribution, blending, station costs and earnings. It is not a measure of additional German profit. Different averaging methods and petrol blends also limit the comparison. S20 S21
Poland announced temporary VAT relief and maximum prices for the second half of August 2026. Comparisons covering August can therefore include temporary policy effects. The September calculation uses the Commission’s dated prices with and without charges. It does not extend the separate file’s temporary 8% VAT entry or infer a detailed Polish tax breakdown from that inconsistent file. S09 S37
US petrol taxes are substantially different. EIA lists a federal petrol tax of 18.4 US cents per gallon and average state taxes and fees of 33.55 cents in January 2026, with additional local differences. Fuel requirements, distances and market conditions also differ. The US price gap cannot be read as a measure of refinery efficiency. S16
13. Assessment of costs, earnings and unresolved questions
Producing and supplying fuel requires labour, energy, equipment, transport and finance. These activities explain why the pump price exceeds the raw-material value. Their existence does not establish that every charge is efficient or that competition is sufficient.
A shortage can produce high profits even without unlawful conduct. Whether such earnings should face additional taxes or other policy measures is a separate question from whether the law was broken. Energy tax, VAT and carbon pricing are also policy choices. Reducing them would change public revenue and incentives, but would not remove fuel shortages or ensure that the full reduction reached motorists.
| Issue | Assessment from the evidence |
|---|---|
| Relationship between WTI and German petrol | A proportional comparison omits exchange rates, other crude and fuel markets, and taxes |
| Costs between crude production and retail sale | Real and necessary in part; available evidence does not justify every observed margin |
| Revenue received by filling stations | Distributed across public charges and several businesses; the local station does not retain the whole difference |
| Government’s share | Large and measurable; public receipts are different from company profit |
| High profits and possible price agreements | High profits alone do not establish a cartel |
| Need for further examination | Supported by the findings and continuing regulatory proceedings |
A numerical example shows the scale of a crude-price change. At 1.1614 dollars per euro, USD 10 per barrel equals about 5.42 euro cents per litre of crude. With 19% VAT, that would be 6.44 cents if the change reached the pump fully and on a one-for-one basis. This is an illustration, not a forecast. Fixed energy tax would not change, while fuel-market prices, exchange rates, blending costs and margins could change. Calculation from S24
A more complete allocation would require refinery output and energy costs, actual fuel purchases, financial price-protection contracts, wholesale agreements, information submitted to price-reporting services, and station commissions and operating accounts. Country-specific profit data would also be needed. Much of this information is not public. Regulatory access can improve the assessment.
The evidence therefore supports several explanations for high fuel prices: comparison differences, taxes, costs, shortages and business earnings. It leaves material questions about competition unresolved. It does not support either an exact “fair price” or treating the entire business share as unavoidable cost.
Method and evidence limits
Scope. Germany is the main market, with Poland, the EU and the US as comparisons. Historical years are 2012, 2014, 2016, 2022 and 2025. Current observations cover 7–9 September 2026, with an evidence cutoff of 10 September. This is an analysis of public sources, not a formal audit or legal opinion.
Evidence. Official prices and tax rules support the calculations. Regulatory reports establish what authorities found. Company disclosures establish what companies reported. Research studies provide estimates that depend on their methods. Several reports repeating the same original source do not count as independent confirmation.
Calculations. Dates, units and formulas are given in the article and source list. Downloadable originals and calculation records are retained in the research files. Annual oil-price and exchange-rate averages provide approximate conversions. Charts and tables use the same underlying calculations.
Access and limitations. Some sources were readable online but could not be downloaded because of server or certificate restrictions. Only the IEA’s public summary was accessed. The Commission’s German and Polish methodology notes date from 2018. Its separate tax file contains outdated entries. The German carbon-related component reconciles published figures; it is not a verified supplier invoice cost. Confidential purchase contracts, trading records and station accounts were not accessed. A complete investigation of ultimate ownership was not performed.
Review and AI use. AI assisted research, calculations, writing, translation, charts and website preparation. This revision explains terminology and simplifies both language editions. Figures, units, dates, calculations, citations and correspondence between editions were checked with AI assistance. Full-session AI usage was not reliably measured; no estimated token total is given. The publisher reviewed the website edition and approved publication on 10 September 2026. There was no independent audit, company consultation, legal specialist review or reader comprehension test. No new finding of unlawful conduct is made.
Reading guide. The opening summary can be read independently. Sections 1–3 explain price comparisons; 4–7 cover production and price components; 8–11 examine recipients, competition and tax relief; 12–13 present country comparisons and the assessment. The source list gives more detailed reference points.
Sources and exact reference points
All sources accessed on 10 September 2026. Each reference links to the source page or document and identifies the relevant passage, table or date. Source numbers identify references in this analysis.
-
S01 · adac.de — 9 September 2026 observation and Brent commentary
-
S02 · adac.de — Annual tables 2012, 2014, 2016, 2022, 2025; E10 definition
-
S03 · eia.gov — Prices after close 8 September 2026; crude, AAA retail and crack-spread tables
-
S04 · eia.gov — Annual Europe Brent Spot Price FOB, selected years
-
S05 · eia.gov — Annual Cushing WTI Spot Price FOB, selected years
-
S06 · energy.ec.europa.eu — Sheet1 A2 date; B13/C13 Germany and B23/C23 Poland; EUR/1000 litres
-
S07 · energy.ec.europa.eu — Sheet1 same date and cells as S06; prices excluding reported taxes
-
S08 · energy.ec.europa.eu — Prices with taxes, row 4; C/D EU; BC/BD Germany; FR/FS Poland; FQ EUR per PLN
-
S09 · energy.ec.europa.eu — Excise duties and VAT sheets: stale relief entries; Other Indirect Taxes Germany row 10
-
S10 · gesetze-im-internet.de — Section 2(1) petrol and diesel normal low-sulphur rates
-
S11 · bundesregierung.de — Measures updated 4 August 2026: relief dates and 12 oclock rule
-
S12 · umweltbundesamt.de — National emissions trading introduction and 2026 EUR55-65 corridor
-
S13 · bundeskartellamt.de — 19 February 2025 final sector inquiry press release: structure and price-reporting services
-
S14 · bundeskartellamt.de — 28 November 2022 interim inquiry release: costs, profits and no indications of agreements
-
S15 · eia.gov — The refining process: separation, conversion and treatment
-
S16 · eia.gov — Gasoline retail prices; taxes; distribution and marketing
-
S17 · eia.gov — Diesel price factors; not used for an unverified federal-tax number
-
S20 · energy.ec.europa.eu — Page 1: E5/B7; arithmetic average; historic 2018 country note
-
S21 · energy.ec.europa.eu — Pages 1-2: market-share weighting and blend descriptions; historic 2018 country note
-
S22 · bundeskartellamt.de — Executive findings; sections on contractual price assessments and refinery/wholesale structures
-
S23 · bundeskartellamt.de — Executive summary; costs/margins pp.58-66; capacity and trade discussion pp.70-74
-
S24 · bundesbank.de — Table II.3 annual averages USD/EUR; Table II.1 8 September daily USD/EUR
-
S25 · statistik.bayern.de — Table 1 Germany CPI, annual overall index 2012/2014/2016/2022/2025
-
S26 · iea.org — 12 August 2026 public highlights; July observed runs; paid full report not accessed
-
S27 · ifo.de — ifo Dresden berichtet 5/2022, pp.13-18: methods and full-period conclusion
-
S28 · ifo.de — 8 June 2026 paper, summary and May analysis; not final May-June estimate
-
S29 · rwi-essen.de — RWI release of study: 87% diesel and 71% E10 over 2022 relief period
-
S31 · shell.com — 30 July 2026 Q2 results transcript, CFO: adjusted earnings and buyback
-
S32 · sec.gov — H1 2026 filing, printed pp.13-14 and 31: refining & trading and reconciliation
-
S33 · aramco.com — 10 March 2026 results, financial bullets: 2025 shareholder distributions
-
S36 · orlen.pl — 6 August 2026: financial bullet list and Consumers & Products section
-
S37 · gov.pl — 14 August 2026: temporary programme from 17 August through holiday end; VAT relief
-
S41 · dallasfed.org — 25 March 2026 survey: special questions; USD43 existing operating and USD66 new drilling
-
S42 · trafigura.com — 4 June 2026: six months ending 31 March; USD4.1bn net profit and pre-conflict timing statement
-
S43 · olg-duesseldorf.nrw.de — 5 May 2026, press release 20/2026; cases VI-Kart 7/25 and 8/25; identifiable-source information
-
S44 · Bundeskartellamt / FinanzNachrichten — 8 September 2026 Bundeskartellamt release, syndicated original; current proceedings and August observations
-
S47 · bundeskartellamt.de — Kraftstoff-News Q2/2026: pp.7,9,10 rebate estimates and limits; later pages price timing
-
S48 · aramco.com — 4 August 2026 financial highlights: H1 adjusted net income USD67.2bn
-
S49 · eia.gov — What is a refinery? US barrel output illustration, not German fixed yields
-
S51 · eia.gov — Inventories, spot/futures relationship and physical-financial market connection
-
S52 · eia.gov — Production targets, spare capacity and constraints on OPEC influence; no current membership or market-share number used
-
S53 · ec.europa.eu — 4 July 2023, petroleum paragraph: embargo dates and changes in suppliers
-
S54 · consilium.europa.eu — 4 February 2023, scope of third-country transport/services price-cap mechanism