A river can register a record-low gauge reading without being only a few centimetres deep. It can also suffer serious ecological and economic damage while water continues to flow. Both points matter when images of exposed riverbeds are presented as evidence that Europe’s rivers are disappearing, or dismissed because droughts happened before. The evidence supports a more precise account: recent low-flow conditions have been widespread, historical droughts were also severe, and the meaning of a “record” depends on the measurement and its reference period. Before comparing the Vistula, Rhine, Loire or Danube across a century, we need to establish what was measured, where, and against which baseline.
A gauge reading is not river depth
On 5 September 2025, Poland’s Institute of Meteorology and Water Management reported a reading of 5 cm at Warsaw–Bulwary on the Vistula. Its explanation was explicit: gauge height measures the water surface relative to an agreed reference level. That reference is not the riverbed. The reading therefore did not mean the river was 5 cm deep across its channel. IMGW, measurements and explanation
Three measurements are often confused. Gauge height is the level above the station’s datum, usually expressed in centimetres. Depth is the distance from the surface to the bed at a particular location. Discharge is the volume of water passing through a cross-section per second, expressed in cubic metres per second. They describe related but different features of a river. IMGW, measurement definitions
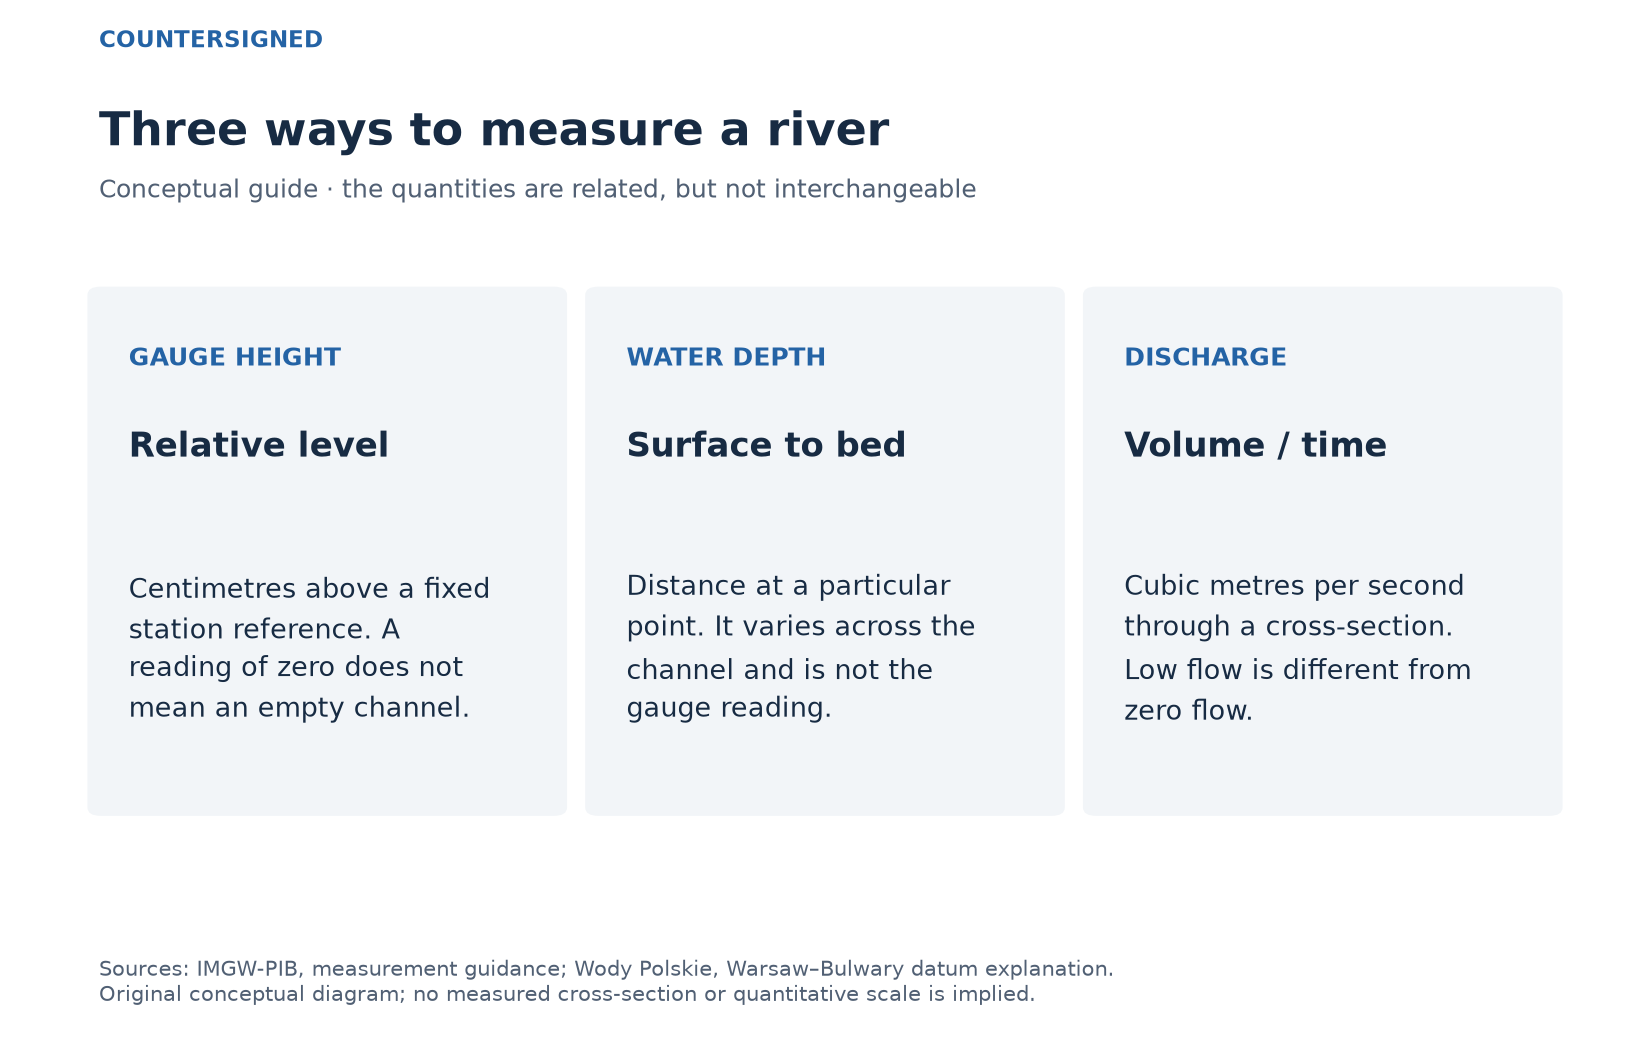
That distinction becomes especially important when a river channel changes. Erosion can lower the bed, and the station’s reference level can be reset. Wody Polskie reports that the Warsaw–Bulwary gauge datum was lowered by 100 cm on 1 November 2025. Under the new reference, the same water-surface elevation produces a reading 100 cm higher. Its example translates a new reading of 184 cm into 84 cm under the old reference. The adjustment changes the number on the gauge, not the quantity of water in the river. Wody Polskie, explanation of the datum change
A comparison across that date therefore needs the appropriate correction. More generally, matching station names is not enough to establish a consistent historical series. A responsible record comparison checks changes in location, reference level and channel geometry before treating successive readings as directly equivalent.
The recent European signal is real
Copernicus reports that river flow across Europe was below average for 11 months in 2025, and that 70% of rivers had below-average annual flow. At the continental scale, May and June had the lowest flow in the series beginning in 1992. The report also documents substantial regional differences, including high spring flows in parts of Iberia. European State of the Climate 2025, river flow
These statistics do not mean that 70% of rivers dried out. “Below average” identifies a position relative to a reference distribution; it does not mean zero discharge. The continental assessment also uses a defined river network and reference period. Its maps show rivers with drainage areas larger than 1,000 square kilometres, so they should not be read as a census of every small stream. The report uses 1992–2020 as its reference period for flow anomalies. Copernicus, figure definitions
The distinction does not make low water harmless. Public water supply, river ecosystems, hydropower and commercial navigation can be affected before a channel stops flowing. A threshold relevant to shipping need not be the threshold used for ecological stress or hydrological drought. One photograph cannot establish all three. Copernicus, interpretation of low flow
Historical drought is part of the evidence
The 1921 European drought provides a useful check against claims that severe drought is wholly new. A reconstruction combining meteorological observations, reanalysis and contemporary newspaper reports found extensive effects on water supply, agriculture and transport. The hardest-hit area was between Brussels, Paris and Lyon, within a much wider affected region. The authors also examined conditions in the Seine catchment. Van der Schrier and colleagues, 2021
That study helps establish the existence and reach of a major historical event. It does not provide a count of all European rivers that stopped flowing between 1900 and 2026. Nor does evidence of an earlier drought establish that the probability or intensity of drought is unchanged today. The paper’s published correction concerns an author’s affiliation, rather than its drought findings. Corrigendum
Historical photographs deserve the same care as current ones. They can show exposed structures, dry margins or interrupted navigation at a place and time. They cannot, without supporting measurements, establish zero flow throughout an entire river. A dried reach and a major river’s complete disappearance are different claims.
Why the choice of drought indicator matters
A separate study by Monica Ionita and Viorica Nagavciuc examined European drought over 1901–2019 using three indices. Indicators that include atmospheric evaporative demand showed drying in central Europe and the Mediterranean, while northern Europe became wetter. A precipitation-only index did not capture the same pattern, particularly where warming was important. Ionita and Nagavciuc, 2021
This is relevant to the argument that rainfall alone settles the question. Water availability depends on more than precipitation totals. However, the study analyses drought indices, not a complete set of observed river discharges. Its findings should not be relabelled as a measured percentage of rivers drying out. The broader inference is that different metrics illuminate different parts of the water balance; they are not interchangeable.
Likewise, a Europe-wide annual average can hide opposite regional conditions. A wet season in one basin does not refute drought in another. A dry summer does not imply that flooding was absent elsewhere in the same year. The scale of the claim should match the scale of the evidence.
A better way to read the next record
Four details make a low-water claim testable: the station, the date, the variable and the comparison period. A report should say whether the record concerns gauge height, discharge or another indicator. It should identify whether the baseline is a local instrument record, a reconstruction or a modern continental dataset. If the gauge datum changed, the comparison should explain the adjustment.
Claims about impacts need their own evidence. Navigation restrictions, intake problems and fish mortality are different outcomes and should be documented separately. None should be inferred solely from the appearance of a bank photographed from a convenient angle. Conversely, continuing flow is not evidence that those impacts cannot occur.
Method and limits
This article compares official measurement guidance, the Copernicus assessment for the complete year 2025, and two historical research papers. It does not claim an exhaustive 126-year inventory or a single record applicable to all European rivers. The unfinished year 2026 is not compared with full-year statistics. An earlier draft’s exact Budapest reading was excluded because the original measurement and historical comparator were not sufficiently verified. Sources were checked on 9 September 2026. The conclusion is bounded: serious low-flow conditions are documented, but their frequency, severity and causes require measurements more precise than “the rivers are drying up.”