Energy emissions moved in different directions between 2015 and 2025. In the Energy Institute’s series, the world total rose from 32.80 to 35.81 billion tonnes of CO₂. The European Union’s total fell, as did those of the United States, Japan and several large European economies. China and India increased their annual emissions substantially. These findings can coexist: reductions in one region do not guarantee a falling global total. But this comparison measures a specific thing, CO₂ associated with burning oil, gas and coal. It is not a complete greenhouse-gas inventory, an estimate of imported emissions or a verdict on any country’s climate policy. Energy Institute, Statistical Review 2026, carbon table
Start with the measurement
The underlying table reports annual emissions in million tonnes. We convert them to billion tonnes, or Gt, and compare 2025 with 2015 within the same edition. The ten-country comparison follows the nominal-GDP cohort used in the original research; Poland and the EU are additional benchmarks. GDP determines the comparison group, not the emissions ranking. It also does not measure population, purchasing power or responsibility for historical warming. World Bank, GDP in current US dollars
Two calculations answer different questions. Absolute change is the 2025 value minus the 2015 value. Percentage change divides that difference by the 2015 value. A small economy can make a large percentage reduction while removing fewer tonnes than a larger economy with a modest proportional improvement. A fair comparison should show both scale and direction.
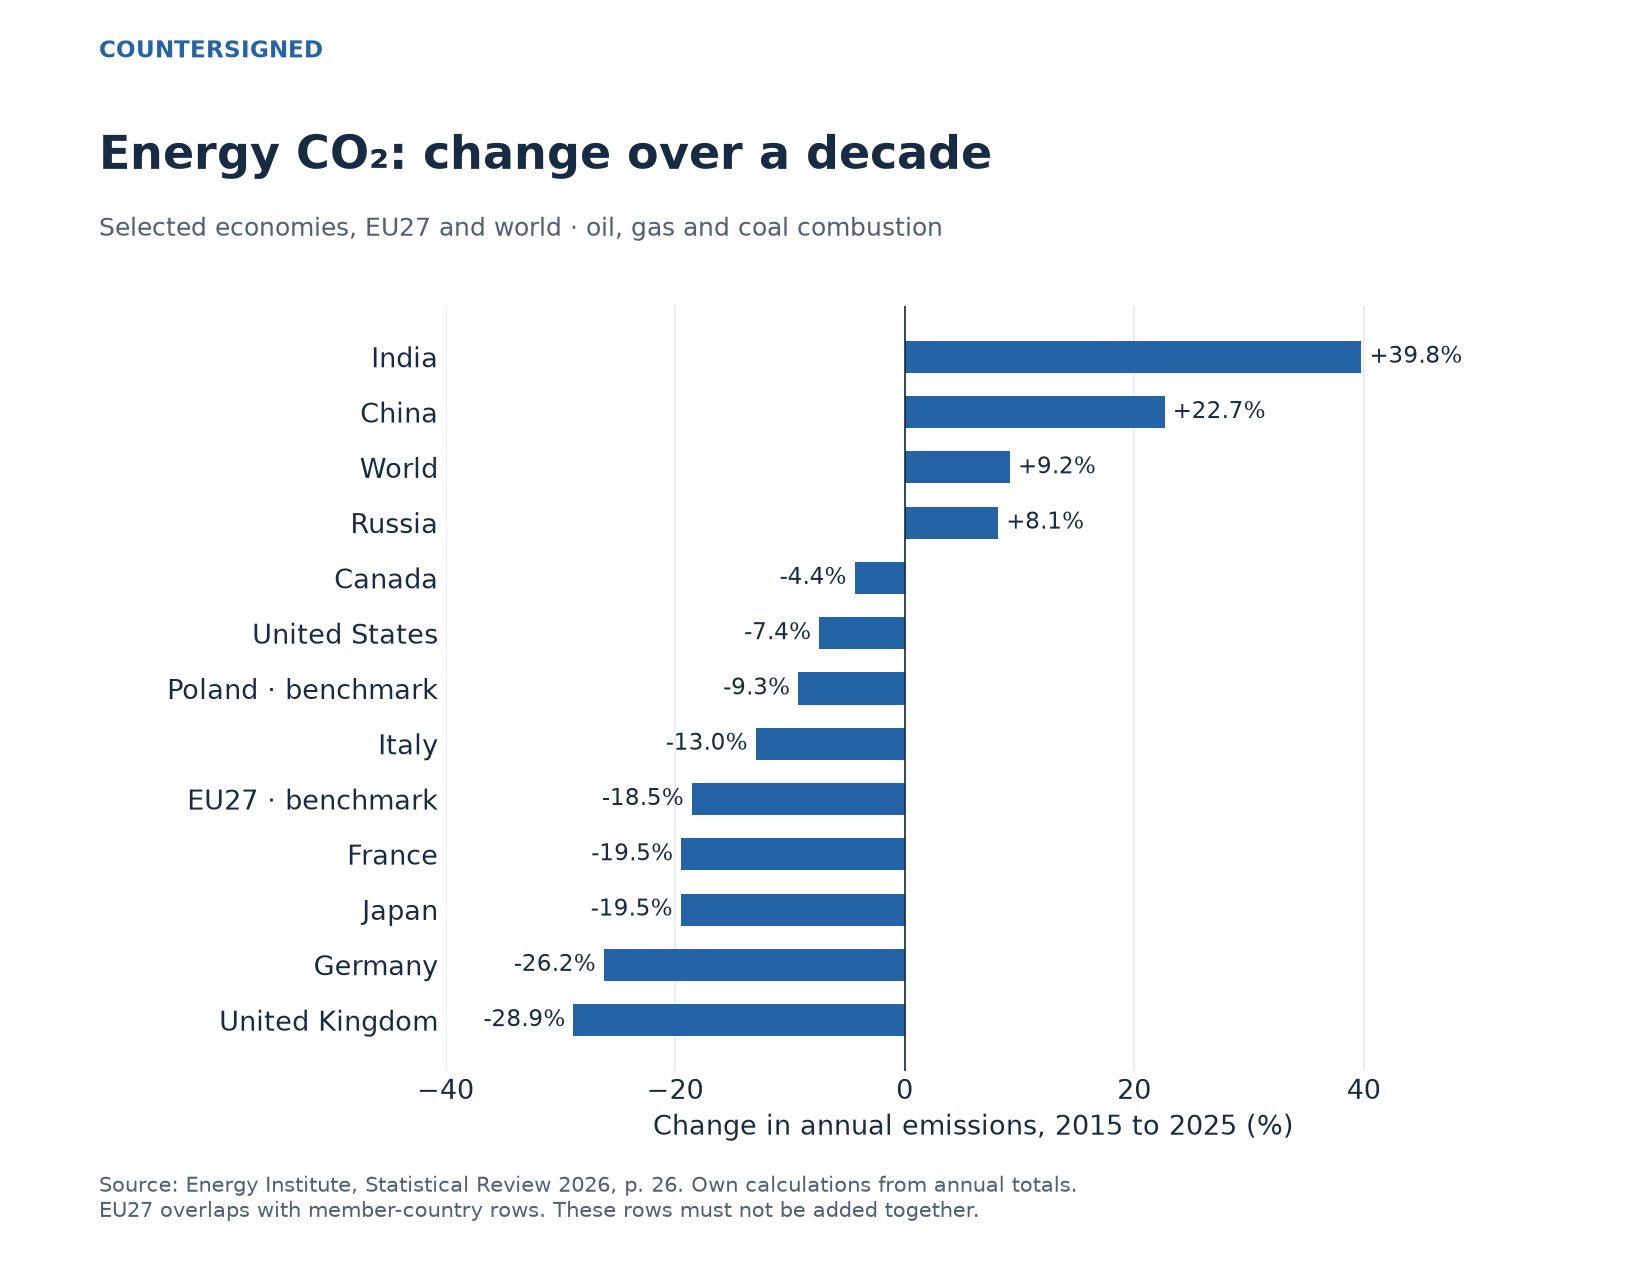
The decade in numbers
The selected endpoints are shown below. Values are rounded for reading; changes use the underlying table precision. These are annual flows in the two years, not the sum of emissions over the decade. Energy Institute, 2026 edition, page 26
| Country or benchmark | 2015, Gt CO₂ | 2025, Gt CO₂ | Change |
|---|---|---|---|
| United States | 5.138 | 4.755 | −7.4% |
| China | 9.148 | 11.220 | +22.7% |
| Germany | 0.756 | 0.558 | −26.2% |
| Japan | 1.217 | 0.980 | −19.5% |
| India | 2.119 | 2.962 | +39.8% |
| United Kingdom | 0.441 | 0.313 | −28.9% |
| France | 0.309 | 0.249 | −19.5% |
| Italy | 0.338 | 0.295 | −13.0% |
| Canada | 0.556 | 0.532 | −4.4% |
| Russia | 1.521 | 1.645 | +8.1% |
| Poland, benchmark | 0.290 | 0.263 | −9.3% |
| EU27, benchmark | 3.045 | 2.481 | −18.5% |
| World | 32.798 | 35.806 | +9.2% |
The EU row overlaps with Germany, France, Italy and Poland. Adding it to those countries would double-count their emissions. The world row is a separate published total, not the sum of the displayed countries. Those boundaries matter whenever a graphic compares regional aggregates with individual states.
China’s increase was about 2.072 Gt and India’s about 0.843 Gt. Combined, that is approximately 2.916 Gt, against a net global increase of 3.008 Gt. The arithmetic ratio is about 97%. It describes the relationship between selected changes and the net world change. It does not mean these countries caused 97% of all emissions, nor that other countries made no additions. Increases and decreases elsewhere partly offset one another. Calculation from the EI table, page 26
Why a global increase does not settle the policy question
A declining EU total and a rising world total establish an accounting pattern. They do not identify what emissions would have been without European policies. To estimate that effect, an evaluation would need a defensible counterfactual and would have to separate policy from economic conditions, weather, fuel prices, industrial structure and technological change.
The reverse claim is equally weak. Falling emissions after a policy begins do not establish that the policy caused the entire reduction. Our baseline is 2015, four years before the European Green Deal was presented. Assigning the whole 2015–2025 change to that programme would ignore the timing of the comparison. Commission, original December 2019 publication
The International Energy Agency illustrates why this distinction matters. Its 2026 review examines both observed emissions and estimated emissions avoided by the deployment of selected clean technologies. An avoided-emissions estimate depends on a comparison with an alternative energy system. It cannot be read directly from a chart of actual annual totals. IEA, Global Energy Review 2026
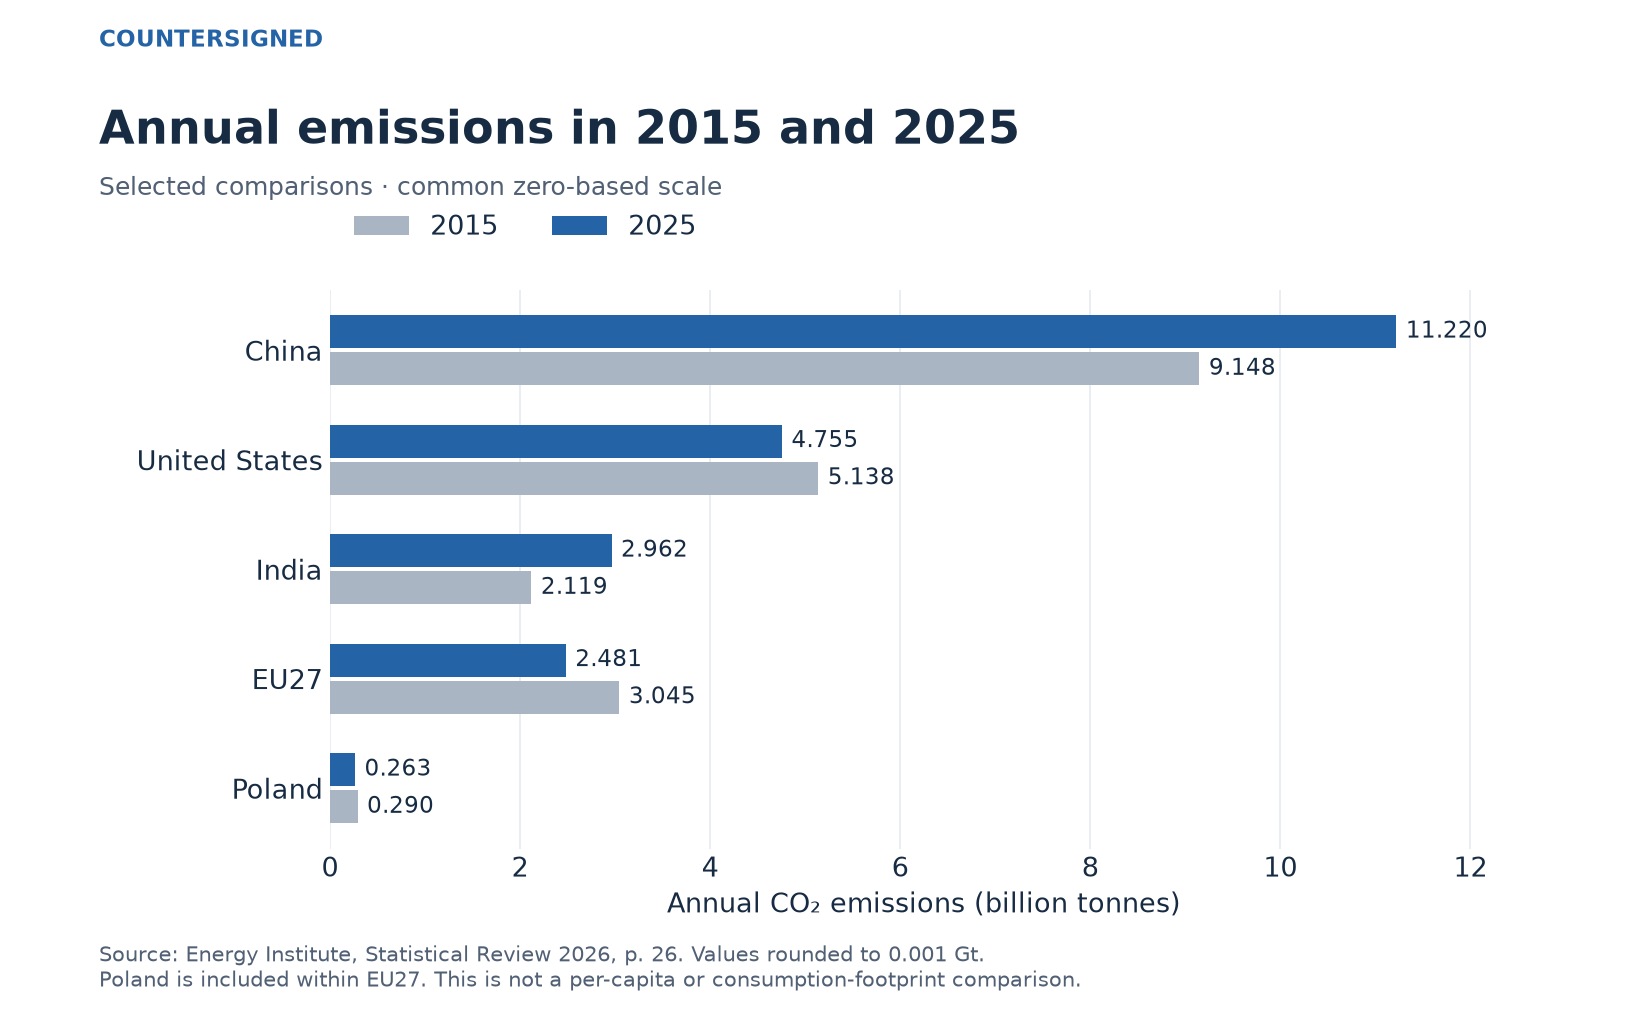
One year can tell a different story
The decade comparison also should not be confused with the latest annual movement. A country can remain below its 2015 level while rising between 2024 and 2025. Conversely, a small annual reduction does not erase a large increase accumulated over earlier years.
There is a second complication: institutions publish different emissions series. The IEA reports nearly 38.4 Gt for its broader 2025 energy-related total, including industrial processes and flaring. Its discussion of China and India also differs from the Energy Institute’s table. These differences involve coverage and estimation methods; this analysis has not decomposed their individual contributions. We therefore do not splice IEA country changes into the EI series. IEA, definitions and regional analysis
Even within one report, a growth-rate column may differ from a simple division of two annual totals. The EI adjusts reported growth rates for leap years. This article’s decade percentages are explicitly calculated from the displayed annual totals. A reader should not compare them with a differently adjusted rate and assume one calculation must be wrong. EI table footnote, reproduced original
What this comparison leaves out
The ranking is not per person. It also does not allocate emissions embodied in traded goods to the final consumer. It excludes a full accounting of methane, nitrous oxide and changes in land use. Each of those lenses could answer a legitimate question, but adding them selectively would create a different and internally inconsistent comparison.
Nor does the chart measure how expensive reductions were, how benefits and costs were distributed, or whether industrial production moved abroad. Those questions require additional data. An emissions decline can be accurately measured while its causes and economic consequences remain contested. The useful result here is narrower: a common series shows the direction and magnitude of change under a stated definition.
Method and source access
All calculations use the 2026 EI edition and annual endpoints for 2015 and 2025. Historical values can be revised between editions. The original research extract was recalculated and checked against the page-26 table reproduced in a public copy of the EI report. The publisher’s full PDF could not be downloaded during this refresh; its official summary was accessible and independently confirms the 2025 world total. This is a comparison of published estimates, not a new national emissions inventory. Sources were checked on 9 September 2026.